

5.7 Study of Intensity Fluctuation Spectra of Dynamic …
417
spectrograms of 12 were obtained with a tense muscle of the right biceps, the other
ones with a relaxed one.
The obtained spectrograms give the possibility to determine the time of muscle
relaxation, as the last one was excited with a natural stress, but not with a large
static load. Meanwhile, two important peculiarities can be mentioned. First, greatest
contrasts display two characteristics—the average spectrum frequency and its asymmetry coefficient. Second (and what is most interesting), the process of muscle relaxation after its tension has a pulsating (wavy) character, and all the characteristics point
at it.
Besides, the works [80–82, 115–117, 122, 123] showed the possibility of determination of relaxation time of biceps muscle when the measurement was conducted
as an exception in the frequency range to 125 Hz. But the signal of intensity fluctuations from the multiplier ran through a low-frequency filter with a cutoff frequency
of 50 Hz, so that the harmonics over the above-mentioned frequency suffered additional relief. Such a bit inconvenient experiment was explained by a desire to reduce
the time of realization accumulation from 8 to 4 s. The calculation of specklogram
frequency was also conducted in the band up to 125 Hz. Oscillation spectra of a
biceps were investigated by healthy people at different measured isometric loads
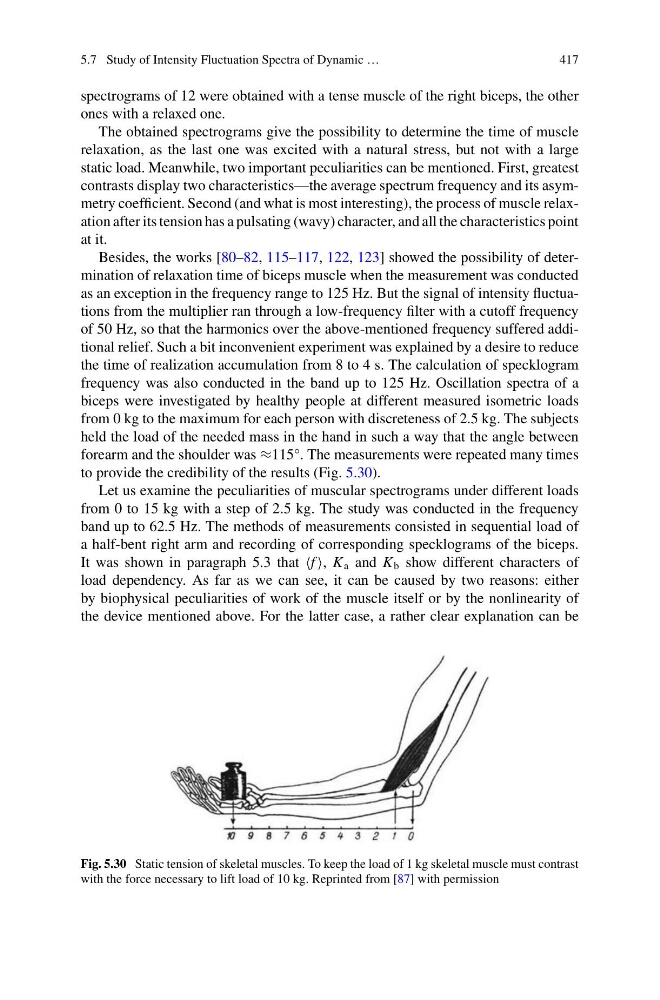
from 0 kg to the maximum for each person with discreteness of 2.5 kg. The subjects
held the load of the needed mass in the hand in such a way that the angle between
forearm and the shoulder was ≈115°. The measurements were repeated many times
to provide the credibility of the results (Fig. 5.30).
Let us examine the peculiarities of muscular spectrograms under different loads
from 0 to 15 kg with a step of 2.5 kg. The study was conducted in the frequency
band up to 62.5 Hz. The methods of measurements consisted in sequential load of
a half-bent right arm and recording of corresponding specklograms of the biceps.
It was shown in paragraph 5.3 that f , K a and K b show different characters of
load dependency. As far as we can see, it can be caused by two reasons: either
by biophysical peculiarities of work of the muscle itself or by the nonlinearity of
the device mentioned above. For the latter case, a rather clear explanation can be
Fig. 5.30 Static tension of skeletal muscles. To keep the load of 1 kg skeletal muscle must contrast
with the force necessary to lift load of 10 kg. Reprinted from [87] with permission
417
spectrograms of 12 were obtained with a tense muscle of the right biceps, the other
ones with a relaxed one.
The obtained spectrograms give the possibility to determine the time of muscle
relaxation, as the last one was excited with a natural stress, but not with a large
static load. Meanwhile, two important peculiarities can be mentioned. First, greatest
contrasts display two characteristics—the average spectrum frequency and its asymmetry coefficient. Second (and what is most interesting), the process of muscle relaxation after its tension has a pulsating (wavy) character, and all the characteristics point
at it.
Besides, the works [80–82, 115–117, 122, 123] showed the possibility of determination of relaxation time of biceps muscle when the measurement was conducted
as an exception in the frequency range to 125 Hz. But the signal of intensity fluctuations from the multiplier ran through a low-frequency filter with a cutoff frequency
of 50 Hz, so that the harmonics over the above-mentioned frequency suffered additional relief. Such a bit inconvenient experiment was explained by a desire to reduce
the time of realization accumulation from 8 to 4 s. The calculation of specklogram
frequency was also conducted in the band up to 125 Hz. Oscillation spectra of a
biceps were investigated by healthy people at different measured isometric loads
from 0 kg to the maximum for each person with discreteness of 2.5 kg. The subjects
held the load of the needed mass in the hand in such a way that the angle between
forearm and the shoulder was ≈115°. The measurements were repeated many times
to provide the credibility of the results (Fig. 5.30).
Let us examine the peculiarities of muscular spectrograms under different loads
from 0 to 15 kg with a step of 2.5 kg. The study was conducted in the frequency
band up to 62.5 Hz. The methods of measurements consisted in sequential load of
a half-bent right arm and recording of corresponding specklograms of the biceps.
It was shown in paragraph 5.3 that f , K a and K b show different characters of
load dependency. As far as we can see, it can be caused by two reasons: either
by biophysical peculiarities of work of the muscle itself or by the nonlinearity of
the device mentioned above. For the latter case, a rather clear explanation can be
Fig. 5.30 Static tension of skeletal muscles. To keep the load of 1 kg skeletal muscle must contrast
with the force necessary to lift load of 10 kg. Reprinted from [87] with permission