

5.5 Study on Optimization of Parameters of Measuring Path …
407
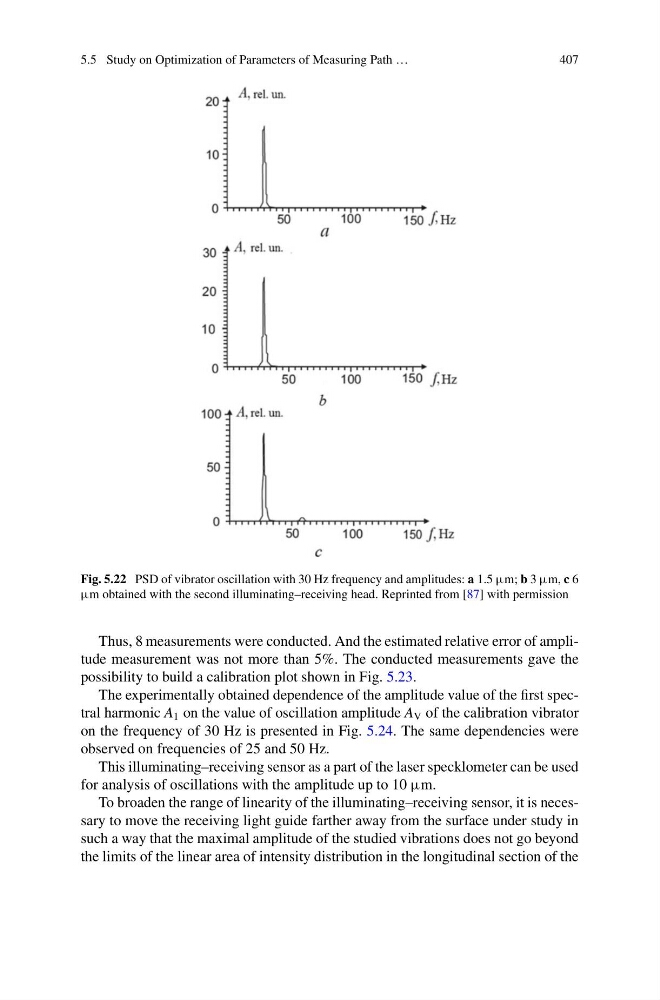
Fig. 5.22 PSD of vibrator oscillation with 30 Hz frequency and amplitudes: a 1.5 μm; b 3 μm, c 6
μm obtained with the second illuminating–receiving head. Reprinted from [87] with permission
Thus, 8 measurements were conducted. And the estimated relative error of amplitude measurement was not more than 5%. The conducted measurements gave the
possibility to build a calibration plot shown in Fig. 5.23.
The experimentally obtained dependence of the amplitude value of the first spectral harmonic A 1 on the value of oscillation amplitude A V of the calibration vibrator
on the frequency of 30 Hz is presented in Fig. 5.24. The same dependencies were
observed on frequencies of 25 and 50 Hz.
This illuminating–receiving sensor as a part of the laser specklometer can be used
for analysis of oscillations with the amplitude up to 10 μm.
To broaden the range of linearity of the illuminating–receiving sensor, it is necessary to move the receiving light guide farther away from the surface under study in
such a way that the maximal amplitude of the studied vibrations does not go beyond
the limits of the linear area of intensity distribution in the longitudinal section of the
407
Fig. 5.22 PSD of vibrator oscillation with 30 Hz frequency and amplitudes: a 1.5 μm; b 3 μm, c 6
μm obtained with the second illuminating–receiving head. Reprinted from [87] with permission
Thus, 8 measurements were conducted. And the estimated relative error of amplitude measurement was not more than 5%. The conducted measurements gave the
possibility to build a calibration plot shown in Fig. 5.23.
The experimentally obtained dependence of the amplitude value of the first spectral harmonic A 1 on the value of oscillation amplitude A V of the calibration vibrator
on the frequency of 30 Hz is presented in Fig. 5.24. The same dependencies were
observed on frequencies of 25 and 50 Hz.
This illuminating–receiving sensor as a part of the laser specklometer can be used
for analysis of oscillations with the amplitude up to 10 μm.
To broaden the range of linearity of the illuminating–receiving sensor, it is necessary to move the receiving light guide farther away from the surface under study in
such a way that the maximal amplitude of the studied vibrations does not go beyond
the limits of the linear area of intensity distribution in the longitudinal section of the