

5.3 Laser Specklometer (Microhematomyograph) …
389
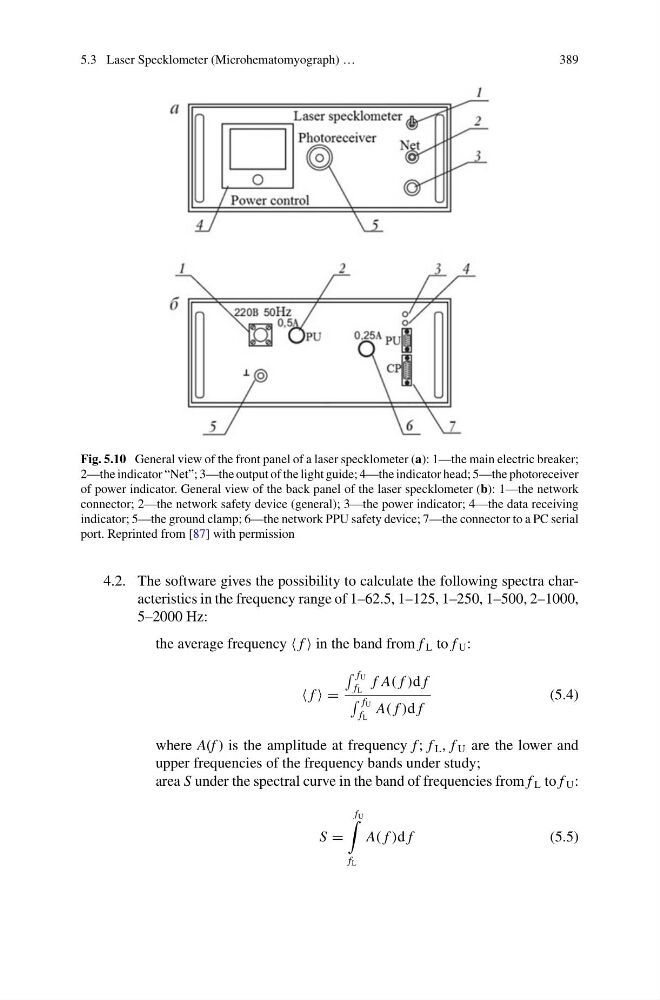
Fig. 5.10 General view of the front panel of a laser specklometer (a): 1—the main electric breaker;
2—the indicator “Net”; 3—the output of the light guide; 4—the indicator head; 5—the photoreceiver
of power indicator. General view of the back panel of the laser specklometer (b): 1—the network
connector; 2—the network safety device (general); 3—the power indicator; 4—the data receiving
indicator; 5—the ground clamp; 6—the network PPU safety device; 7—the connector to a PC serial
port. Reprinted from [87] with permission
4.2. The software gives the possibility to calculate the following spectra characteristics in the frequency range of 1–62.5, 1–125, 1–250, 1–500, 2–1000,
5–2000 Hz:
the average frequency f in the band from f L to f U :
f =
f U
f L
f A( f )d f
f U
f L
A( f )d f
(5.4)
where A(f ) is the amplitude at frequency f ; f L , f U are the lower and
upper frequencies of the frequency bands under study;
area S under the spectral curve in the band of frequencies from f L to f U :
S =
f U
f L
A( f )d f
(5.5)
389
Fig. 5.10 General view of the front panel of a laser specklometer (a): 1—the main electric breaker;
2—the indicator “Net”; 3—the output of the light guide; 4—the indicator head; 5—the photoreceiver
of power indicator. General view of the back panel of the laser specklometer (b): 1—the network
connector; 2—the network safety device (general); 3—the power indicator; 4—the data receiving
indicator; 5—the ground clamp; 6—the network PPU safety device; 7—the connector to a PC serial
port. Reprinted from [87] with permission
4.2. The software gives the possibility to calculate the following spectra characteristics in the frequency range of 1–62.5, 1–125, 1–250, 1–500, 2–1000,
5–2000 Hz:
the average frequency f in the band from f L to f U :
f =
f U
f L
f A( f )d f
f U
f L
A( f )d f
(5.4)
where A(f ) is the amplitude at frequency f ; f L , f U are the lower and
upper frequencies of the frequency bands under study;
area S under the spectral curve in the band of frequencies from f L to f U :
S =
f U
f L
A( f )d f
(5.5)