

312
4 Speckle-Optical Methods and Devices for Studying …
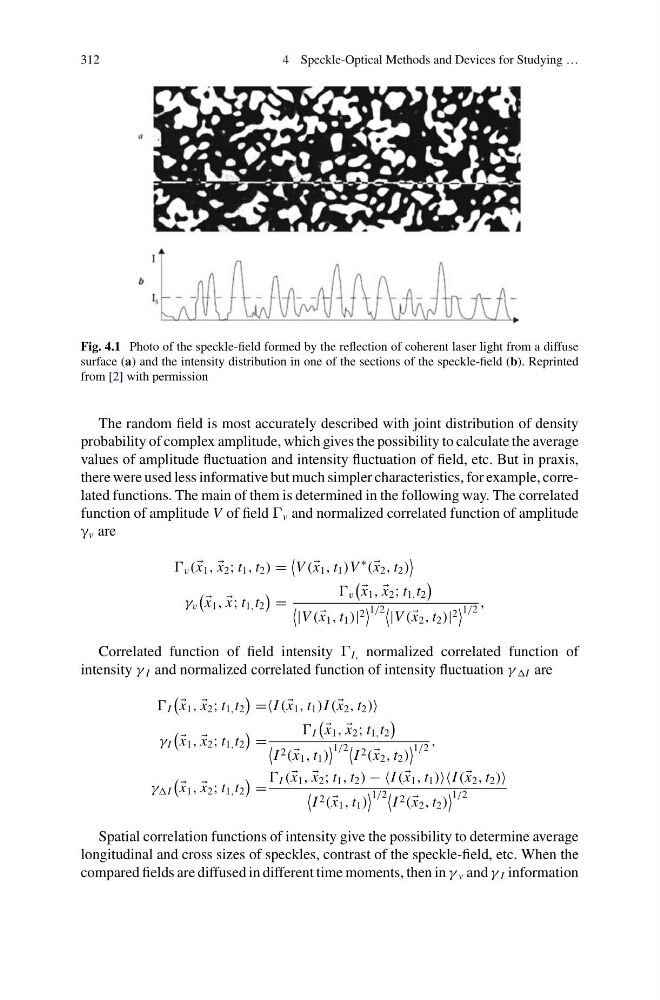
Fig. 4.1 Photo of the speckle-field formed by the reflection of coherent laser light from a diffuse
surface (a) and the intensity distribution in one of the sections of the speckle-field (b). Reprinted
from [2] with permission
The random field is most accurately described with joint distribution of density
probability of complex amplitude, which gives the possibility to calculate the average
values of amplitude fluctuation and intensity fluctuation of field, etc. But in praxis,
there were used less informative but much simpler characteristics, for example, correlated functions. The main of them is determined in the following way. The correlated
function of amplitude V of field G v and normalized correlated function of amplitude
γ v are
v ( x 1 ,
x 2 ; t 1 , t 2 ) =
V ( x 1 , t 1 )V
∗
( x 2 , t 2 )
γ v
x 1 ,
x; t 1, t 2
=
v
x 1 ,
x 2 ; t 1, t 2
|V ( x 1 , t 1 )| 2
1/2 |V ( x 2 , t 2 )| 2
1/2 ,
Correlated function of field intensity G I, normalized correlated function of
intensity γ I and normalized correlated function of intensity fluctuation γ I are
I
x 1 ,
x 2 ; t 1, t 2
=I ( x 1 , t 1 )I ( x 2 , t 2 )
γ I
x 1 ,
x 2 ; t 1, t 2
=
I
x 1 ,
x 2 ; t 1, t 2
I 2 ( x 1 , t 1 )
1/2
I 2 ( x 2 , t 2 )
1/2 ,
γ I
x 1 ,
x 2 ; t 1, t 2
=
I ( x 1 ,
x 2 ; t 1 , t 2 ) − −I ( x 1 , t 1 )I ( x 2 , t 2 )
I 2 ( x 1 , t 1 )
1/2
I 2 ( x 2 , t 2 )
1/2
Spatial correlation functions of intensity give the possibility to determine average
longitudinal and cross sizes of speckles, contrast of the speckle-field, etc. When the
compared fields are diffused in different time moments, then in γ v and γ I information
4 Speckle-Optical Methods and Devices for Studying …
Fig. 4.1 Photo of the speckle-field formed by the reflection of coherent laser light from a diffuse
surface (a) and the intensity distribution in one of the sections of the speckle-field (b). Reprinted
from [2] with permission
The random field is most accurately described with joint distribution of density
probability of complex amplitude, which gives the possibility to calculate the average
values of amplitude fluctuation and intensity fluctuation of field, etc. But in praxis,
there were used less informative but much simpler characteristics, for example, correlated functions. The main of them is determined in the following way. The correlated
function of amplitude V of field G v and normalized correlated function of amplitude
γ v are
v ( x 1 ,
x 2 ; t 1 , t 2 ) =
V ( x 1 , t 1 )V
∗
( x 2 , t 2 )
γ v
x 1 ,
x; t 1, t 2
=
v
x 1 ,
x 2 ; t 1, t 2
|V ( x 1 , t 1 )| 2
1/2 |V ( x 2 , t 2 )| 2
1/2 ,
Correlated function of field intensity G I, normalized correlated function of
intensity γ I and normalized correlated function of intensity fluctuation γ I are
I
x 1 ,
x 2 ; t 1, t 2
=I ( x 1 , t 1 )I ( x 2 , t 2 )
γ I
x 1 ,
x 2 ; t 1, t 2
=
I
x 1 ,
x 2 ; t 1, t 2
I 2 ( x 1 , t 1 )
1/2
I 2 ( x 2 , t 2 )
1/2 ,
γ I
x 1 ,
x 2 ; t 1, t 2
=
I ( x 1 ,
x 2 ; t 1 , t 2 ) − −I ( x 1 , t 1 )I ( x 2 , t 2 )
I 2 ( x 1 , t 1 )
1/2
I 2 ( x 2 , t 2 )
1/2
Spatial correlation functions of intensity give the possibility to determine average
longitudinal and cross sizes of speckles, contrast of the speckle-field, etc. When the
compared fields are diffused in different time moments, then in γ v and γ I information