

2.2 Holographic Study of Structural and Functional Characteristics …
109
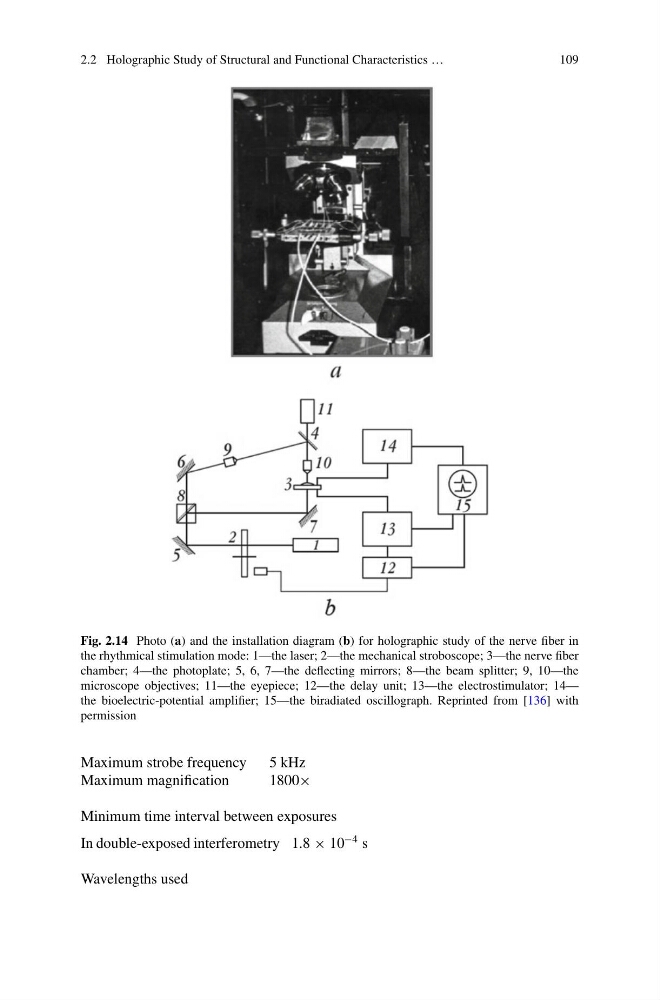
Fig. 2.14 Photo (a) and the installation diagram (b) for holographic study of the nerve fiber in
the rhythmical stimulation mode: 1—the laser; 2—the mechanical stroboscope; 3—the nerve fiber
chamber; 4—the photoplate; 5, 6, 7—the deflecting mirrors; 8—the beam splitter; 9, 10—the
microscope objectives; 11—the eyepiece; 12—the delay unit; 13—the electrostimulator; 14—
the bioelectric-potential amplifier; 15—the biradiated oscillograph. Reprinted from [136] with
permission
Maximum strobe frequency
5 kHz
Maximum magnification
1800×
Minimum time interval between exposures
In double-exposed interferometry 1.8 × 10
−4 s
Wavelengths used
109
Fig. 2.14 Photo (a) and the installation diagram (b) for holographic study of the nerve fiber in
the rhythmical stimulation mode: 1—the laser; 2—the mechanical stroboscope; 3—the nerve fiber
chamber; 4—the photoplate; 5, 6, 7—the deflecting mirrors; 8—the beam splitter; 9, 10—the
microscope objectives; 11—the eyepiece; 12—the delay unit; 13—the electrostimulator; 14—
the bioelectric-potential amplifier; 15—the biradiated oscillograph. Reprinted from [136] with
permission
Maximum strobe frequency
5 kHz
Maximum magnification
1800×
Minimum time interval between exposures
In double-exposed interferometry 1.8 × 10
−4 s
Wavelengths used