

6.2 Flow Field of Side-Blown Shielding Gas (for Titanium Alloy)
167
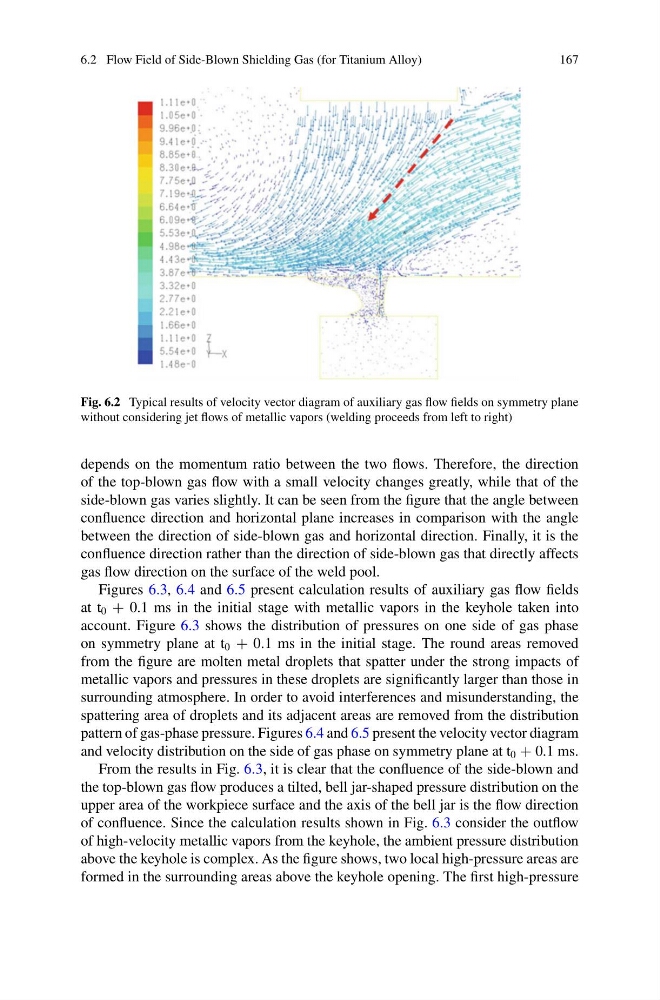
Fig. 6.2 Typical results of velocity vector diagram of auxiliary gas flow fields on symmetry plane
without considering jet flows of metallic vapors (welding proceeds from left to right)
depends on the momentum ratio between the two flows. Therefore, the direction
of the top-blown gas flow with a small velocity changes greatly, while that of the
side-blown gas varies slightly. It can be seen from the figure that the angle between
confluence direction and horizontal plane increases in comparison with the angle
between the direction of side-blown gas and horizontal direction. Finally, it is the
confluence direction rather than the direction of side-blown gas that directly affects
gas flow direction on the surface of the weld pool.
Figures 6.3, 6.4 and 6.5 present calculation results of auxiliary gas flow fields
at t 0 + 0.1 ms in the initial stage with metallic vapors in the keyhole taken into
account. Figure 6.3 shows the distribution of pressures on one side of gas phase
on symmetry plane at t 0 + 0.1 ms in the initial stage. The round areas removed
from the figure are molten metal droplets that spatter under the strong impacts of
metallic vapors and pressures in these droplets are significantly larger than those in
surrounding atmosphere. In order to avoid interferences and misunderstanding, the
spattering area of droplets and its adjacent areas are removed from the distribution
pattern of gas-phase pressure. Figures 6.4 and 6.5 present the velocity vector diagram
and velocity distribution on the side of gas phase on symmetry plane at t 0 + 0.1 ms.
From the results in Fig. 6.3, it is clear that the confluence of the side-blown and
the top-blown gas flow produces a tilted, bell jar-shaped pressure distribution on the
upper area of the workpiece surface and the axis of the bell jar is the flow direction
of confluence. Since the calculation results shown in Fig. 6.3 consider the outflow
of high-velocity metallic vapors from the keyhole, the ambient pressure distribution
above the keyhole is complex. As the figure shows, two local high-pressure areas are
formed in the surrounding areas above the keyhole opening. The first high-pressure
167
Fig. 6.2 Typical results of velocity vector diagram of auxiliary gas flow fields on symmetry plane
without considering jet flows of metallic vapors (welding proceeds from left to right)
depends on the momentum ratio between the two flows. Therefore, the direction
of the top-blown gas flow with a small velocity changes greatly, while that of the
side-blown gas varies slightly. It can be seen from the figure that the angle between
confluence direction and horizontal plane increases in comparison with the angle
between the direction of side-blown gas and horizontal direction. Finally, it is the
confluence direction rather than the direction of side-blown gas that directly affects
gas flow direction on the surface of the weld pool.
Figures 6.3, 6.4 and 6.5 present calculation results of auxiliary gas flow fields
at t 0 + 0.1 ms in the initial stage with metallic vapors in the keyhole taken into
account. Figure 6.3 shows the distribution of pressures on one side of gas phase
on symmetry plane at t 0 + 0.1 ms in the initial stage. The round areas removed
from the figure are molten metal droplets that spatter under the strong impacts of
metallic vapors and pressures in these droplets are significantly larger than those in
surrounding atmosphere. In order to avoid interferences and misunderstanding, the
spattering area of droplets and its adjacent areas are removed from the distribution
pattern of gas-phase pressure. Figures 6.4 and 6.5 present the velocity vector diagram
and velocity distribution on the side of gas phase on symmetry plane at t 0 + 0.1 ms.
From the results in Fig. 6.3, it is clear that the confluence of the side-blown and
the top-blown gas flow produces a tilted, bell jar-shaped pressure distribution on the
upper area of the workpiece surface and the axis of the bell jar is the flow direction
of confluence. Since the calculation results shown in Fig. 6.3 consider the outflow
of high-velocity metallic vapors from the keyhole, the ambient pressure distribution
above the keyhole is complex. As the figure shows, two local high-pressure areas are
formed in the surrounding areas above the keyhole opening. The first high-pressure