

52
2 Voxel-Based Inversion Via Set-Theoretic Estimation
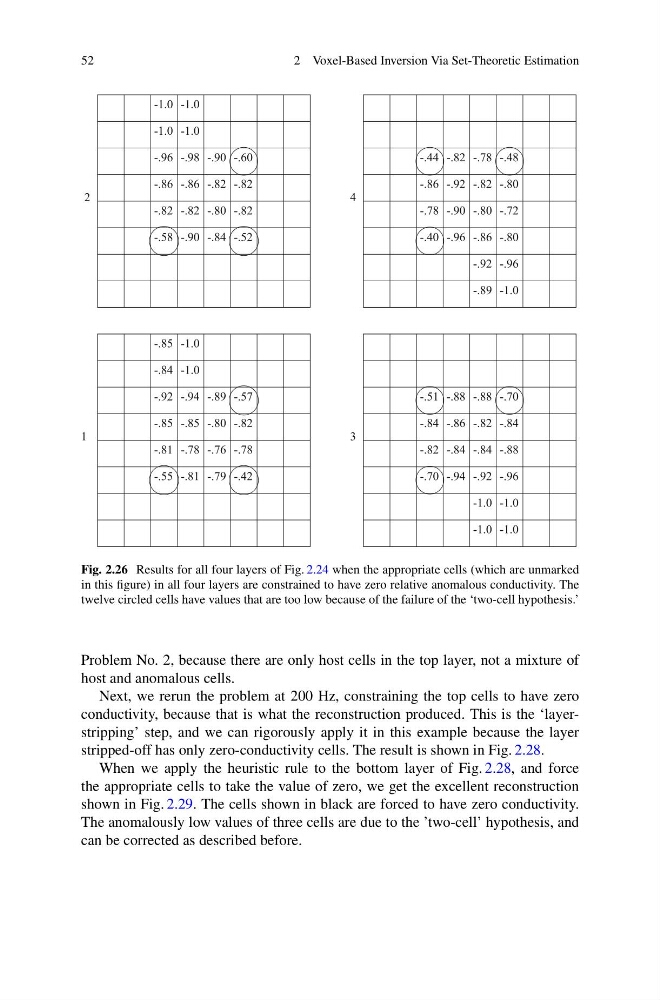
Fig. 2.26 Results for all four layers of Fig. 2.24 when the appropriate cells (which are unmarked
in this figure) in all four layers are constrained to have zero relative anomalous conductivity. The
twelve circled cells have values that are too low because of the failure of the ‘two-cell hypothesis.’
Problem No. 2, because there are only host cells in the top layer, not a mixture of
host and anomalous cells.
Next, we rerun the problem at 200 Hz, constraining the top cells to have zero
conductivity, because that is what the reconstruction produced. This is the ‘layerstripping’ step, and we can rigorously apply it in this example because the layer
stripped-off has only zero-conductivity cells. The result is shown in Fig. 2.28.
When we apply the heuristic rule to the bottom layer of Fig. 2.28, and force
the appropriate cells to take the value of zero, we get the excellent reconstruction
shown in Fig. 2.29. The cells shown in black are forced to have zero conductivity.
The anomalously low values of three cells are due to the ’two-cell’ hypothesis, and
can be corrected as described before.
2 Voxel-Based Inversion Via Set-Theoretic Estimation
Fig. 2.26 Results for all four layers of Fig. 2.24 when the appropriate cells (which are unmarked
in this figure) in all four layers are constrained to have zero relative anomalous conductivity. The
twelve circled cells have values that are too low because of the failure of the ‘two-cell hypothesis.’
Problem No. 2, because there are only host cells in the top layer, not a mixture of
host and anomalous cells.
Next, we rerun the problem at 200 Hz, constraining the top cells to have zero
conductivity, because that is what the reconstruction produced. This is the ‘layerstripping’ step, and we can rigorously apply it in this example because the layer
stripped-off has only zero-conductivity cells. The result is shown in Fig. 2.28.
When we apply the heuristic rule to the bottom layer of Fig. 2.28, and force
the appropriate cells to take the value of zero, we get the excellent reconstruction
shown in Fig. 2.29. The cells shown in black are forced to have zero conductivity.
The anomalously low values of three cells are due to the ’two-cell’ hypothesis, and
can be corrected as described before.