

11.5 Crystalline Anisotropy and TiO 2
305
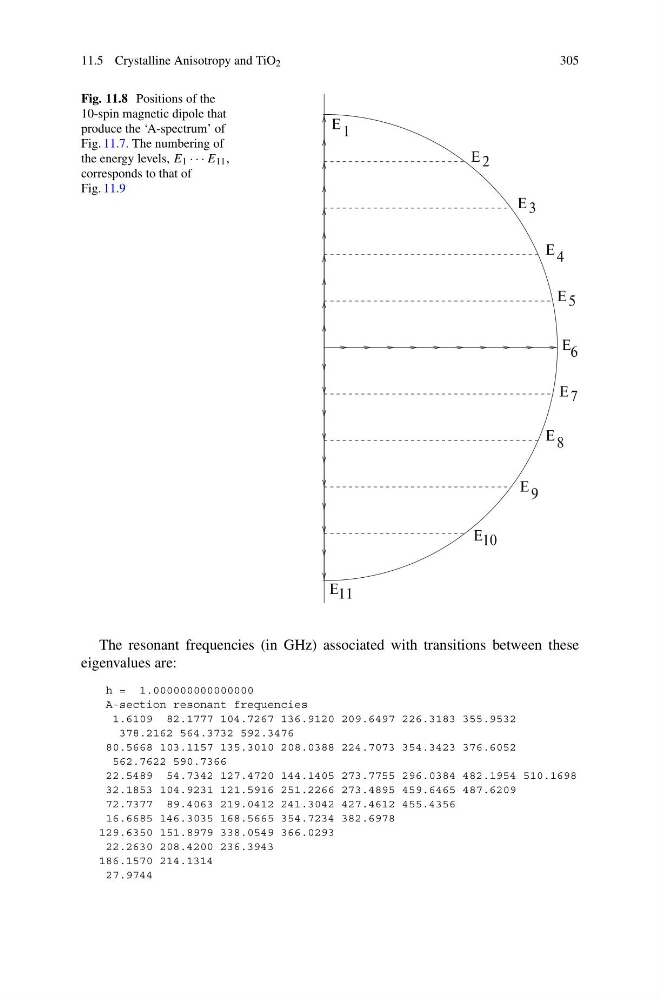
Fig. 11.8 Positions of the
10-spin magnetic dipole that
produce the ‘A-spectrum’ of
Fig. 11.7. The numbering of
the energy levels, E 1 · · · E 11 ,
corresponds to that of
Fig. 11.9
E 1
E 2
E 3
E 4
E 5
E
6
E 7
E 8
E 9
E 10
E 11
The resonant frequencies (in GHz) associated with transitions between these
eigenvalues are:
h = 1.000000000000000
A-section resonant frequencies
1.6109 82.1777 104.7267 136.9120 209.6497 226.3183 355.9532
378.2162 564.3732 592.3476
80.5668 103.1157 135.3010 208.0388 224.7073 354.3423 376.6052
562.7622 590.7366
22.5489 54.7342 127.4720 144.1405 273.7755 296.0384 482.1954 510.1698
32.1853 104.9231 121.5916 251.2266 273.4895 459.6465 487.6209
72.7377 89.4063 219.0412 241.3042 427.4612 455.4356
16.6685 146.3035 168.5665 354.7234 382.6978
129.6350 151.8979 338.0549 366.0293
22.2630 208.4200 236.3943
186.1570 214.1314
27.9744
305
Fig. 11.8 Positions of the
10-spin magnetic dipole that
produce the ‘A-spectrum’ of
Fig. 11.7. The numbering of
the energy levels, E 1 · · · E 11 ,
corresponds to that of
Fig. 11.9
E 1
E 2
E 3
E 4
E 5
E
6
E 7
E 8
E 9
E 10
E 11
The resonant frequencies (in GHz) associated with transitions between these
eigenvalues are:
h = 1.000000000000000
A-section resonant frequencies
1.6109 82.1777 104.7267 136.9120 209.6497 226.3183 355.9532
378.2162 564.3732 592.3476
80.5668 103.1157 135.3010 208.0388 224.7073 354.3423 376.6052
562.7622 590.7366
22.5489 54.7342 127.4720 144.1405 273.7755 296.0384 482.1954 510.1698
32.1853 104.9231 121.5916 251.2266 273.4895 459.6465 487.6209
72.7377 89.4063 219.0412 241.3042 427.4612 455.4356
16.6685 146.3035 168.5665 354.7234 382.6978
129.6350 151.8979 338.0549 366.0293
22.2630 208.4200 236.3943
186.1570 214.1314
27.9744