

10.6 Electromagnetic Modeling of Biological Tissue
265
8.5e-07
9e-07
9.5e-07
1e-06
1.05e-06
1.1e-06
1.15e-06
1.2e-06
1.25e-06
8.8
9
9.2
9.4
9.6
9.8
10
Resistance (Ohms)
Frequency (E8)
Response of Lesions at 1GHz
original
variation 1
variation 2
variation 3
variation 4
2e-06
2.2e-06
2.4e-06
2.6e-06
2.8e-06
3e-06
3.2e-06
3.4e-06
8.8
9
9.2
9.4
9.6
9.8
10
Reactance (Ohms)
Frequency (E8)
Response of Lesions at 1GHz
original
variation 1
variation 2
variation 3
variation 4
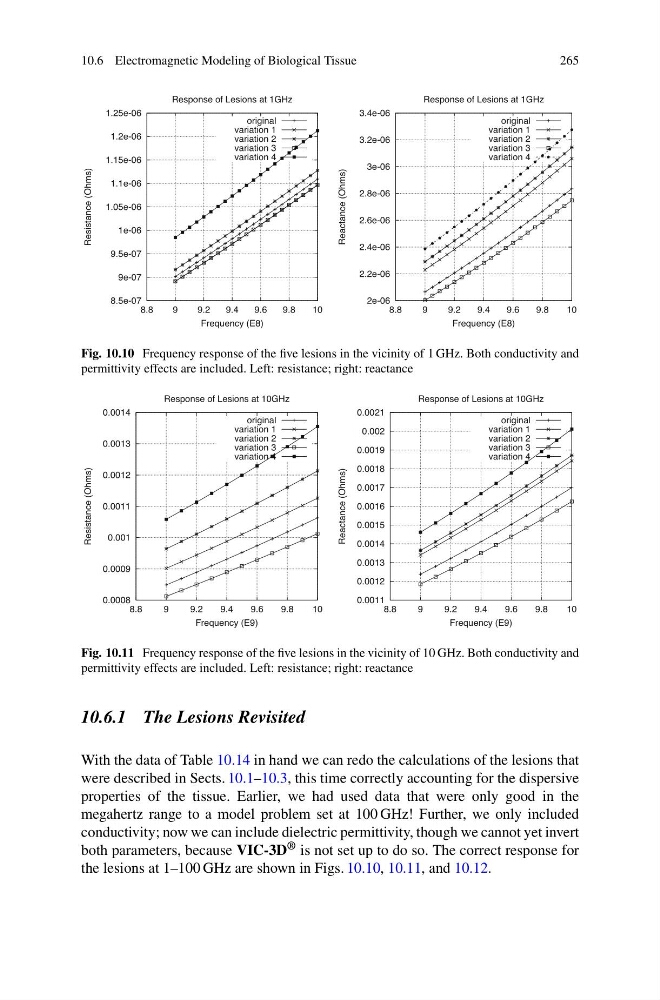
Fig. 10.10 Frequency response of the five lesions in the vicinity of 1 GHz. Both conductivity and
permittivity effects are included. Left: resistance; right: reactance
0.0008
0.0009
0.001
0.0011
0.0012
0.0013
0.0014
8.8
9
9.2
9.4
9.6
9.8
10
Resistance (Ohms)
Frequency (E9)
Response of Lesions at 10GHz
original
variation 1
variation 2
variation 3
variation 4
0.0011
0.0012
0.0013
0.0014
0.0015
0.0016
0.0017
0.0018
0.0019
0.002
0.0021
8.8
9
9.2
9.4
9.6
9.8
10
Reactance (Ohms)
Frequency (E9)
Response of Lesions at 10GHz
original
variation 1
variation 2
variation 3
variation 4
Fig. 10.11 Frequency response of the five lesions in the vicinity of 10 GHz. Both conductivity and
permittivity effects are included. Left: resistance; right: reactance
10.6.1 The Lesions Revisited
With the data of Table 10.14 in hand we can redo the calculations of the lesions that
were described in Sects. 10.1–10.3, this time correctly accounting for the dispersive
properties of the tissue. Earlier, we had used data that were only good in the
megahertz range to a model problem set at 100 GHz! Further, we only included
conductivity; now we can include dielectric permittivity, though we cannot yet invert
both parameters, because VIC-3D ® is not set up to do so. The correct response for
the lesions at 1–100 GHz are shown in Figs. 10.10, 10.11, and 10.12.
265
8.5e-07
9e-07
9.5e-07
1e-06
1.05e-06
1.1e-06
1.15e-06
1.2e-06
1.25e-06
8.8
9
9.2
9.4
9.6
9.8
10
Resistance (Ohms)
Frequency (E8)
Response of Lesions at 1GHz
original
variation 1
variation 2
variation 3
variation 4
2e-06
2.2e-06
2.4e-06
2.6e-06
2.8e-06
3e-06
3.2e-06
3.4e-06
8.8
9
9.2
9.4
9.6
9.8
10
Reactance (Ohms)
Frequency (E8)
Response of Lesions at 1GHz
original
variation 1
variation 2
variation 3
variation 4
Fig. 10.10 Frequency response of the five lesions in the vicinity of 1 GHz. Both conductivity and
permittivity effects are included. Left: resistance; right: reactance
0.0008
0.0009
0.001
0.0011
0.0012
0.0013
0.0014
8.8
9
9.2
9.4
9.6
9.8
10
Resistance (Ohms)
Frequency (E9)
Response of Lesions at 10GHz
original
variation 1
variation 2
variation 3
variation 4
0.0011
0.0012
0.0013
0.0014
0.0015
0.0016
0.0017
0.0018
0.0019
0.002
0.0021
8.8
9
9.2
9.4
9.6
9.8
10
Reactance (Ohms)
Frequency (E9)
Response of Lesions at 10GHz
original
variation 1
variation 2
variation 3
variation 4
Fig. 10.11 Frequency response of the five lesions in the vicinity of 10 GHz. Both conductivity and
permittivity effects are included. Left: resistance; right: reactance
10.6.1 The Lesions Revisited
With the data of Table 10.14 in hand we can redo the calculations of the lesions that
were described in Sects. 10.1–10.3, this time correctly accounting for the dispersive
properties of the tissue. Earlier, we had used data that were only good in the
megahertz range to a model problem set at 100 GHz! Further, we only included
conductivity; now we can include dielectric permittivity, though we cannot yet invert
both parameters, because VIC-3D ® is not set up to do so. The correct response for
the lesions at 1–100 GHz are shown in Figs. 10.10, 10.11, and 10.12.