

262
10 Characterization of Atherosclerotic Lesions by Inversion. . .
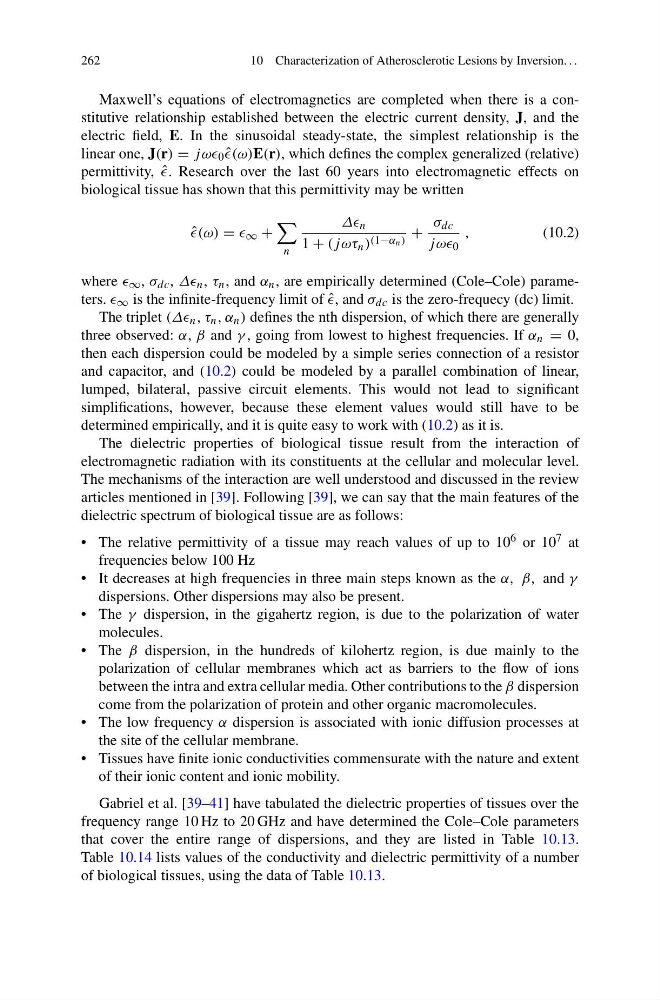
Maxwell’s equations of electromagnetics are completed when there is a constitutive relationship established between the electric current density, J, and the
electric field, E. In the sinusoidal steady-state, the simplest relationship is the
linear one, J(r) = jωω 0 ˆ
which defines the complex generalized (relative)
permittivity, ˆ
. Research over the last 60 years into electromagnetic effects on
biological tissue has shown that this permittivity may be written
ˆ
= ∞ +
n
ΔΔ n
1 + (j ωτ n ) (1−α n ) +
σ dc
jωω 0
,
(10.2)
where ∞ , σ dc , ΔΔ n , τ n , and α n , are empirically determined (Cole–Cole) parameters. ∞ is the infinite-frequency limit of ˆ
, and σ dc is the zero-frequecy (dc) limit.
The triplet (ΔΔ n , τ n , α n ) defines the nth dispersion, of which there are generally
three observed: α, β and γ , going from lowest to highest frequencies. If α n = 0,
then each dispersion could be modeled by a simple series connection of a resistor
and capacitor, and (10.2) could be modeled by a parallel combination of linear,
lumped, bilateral, passive circuit elements. This would not lead to significant
simplifications, however, because these element values would still have to be
determined empirically, and it is quite easy to work with (10.2) as it is.
The dielectric properties of biological tissue result from the interaction of
electromagnetic radiation with its constituents at the cellular and molecular level.
The mechanisms of the interaction are well understood and discussed in the review
articles mentioned in [39]. Following [39], we can say that the main features of the
dielectric spectrum of biological tissue are as follows:
• The relative permittivity of a tissue may reach values of up to 10 6 or 10 7 at
frequencies below 100 Hz
• It decreases at high frequencies in three main steps known as the α, β, and γ
dispersions. Other dispersions may also be present.
• The γ dispersion, in the gigahertz region, is due to the polarization of water
molecules.
• The β dispersion, in the hundreds of kilohertz region, is due mainly to the
polarization of cellular membranes which act as barriers to the flow of ions
between the intra and extra cellular media. Other contributions to the β dispersion
come from the polarization of protein and other organic macromolecules.
• The low frequency α dispersion is associated with ionic diffusion processes at
the site of the cellular membrane.
• Tissues have finite ionic conductivities commensurate with the nature and extent
of their ionic content and ionic mobility.
Gabriel et al. [39–41] have tabulated the dielectric properties of tissues over the
frequency range 10 Hz to 20 GHz and have determined the Cole–Cole parameters
that cover the entire range of dispersions, and they are listed in Table 10.13.
Table 10.14 lists values of the conductivity and dielectric permittivity of a number
of biological tissues, using the data of Table 10.13.
10 Characterization of Atherosclerotic Lesions by Inversion. . .
Maxwell’s equations of electromagnetics are completed when there is a constitutive relationship established between the electric current density, J, and the
electric field, E. In the sinusoidal steady-state, the simplest relationship is the
linear one, J(r) = jωω 0 ˆ
which defines the complex generalized (relative)
permittivity, ˆ
. Research over the last 60 years into electromagnetic effects on
biological tissue has shown that this permittivity may be written
ˆ
= ∞ +
n
ΔΔ n
1 + (j ωτ n ) (1−α n ) +
σ dc
jωω 0
,
(10.2)
where ∞ , σ dc , ΔΔ n , τ n , and α n , are empirically determined (Cole–Cole) parameters. ∞ is the infinite-frequency limit of ˆ
, and σ dc is the zero-frequecy (dc) limit.
The triplet (ΔΔ n , τ n , α n ) defines the nth dispersion, of which there are generally
three observed: α, β and γ , going from lowest to highest frequencies. If α n = 0,
then each dispersion could be modeled by a simple series connection of a resistor
and capacitor, and (10.2) could be modeled by a parallel combination of linear,
lumped, bilateral, passive circuit elements. This would not lead to significant
simplifications, however, because these element values would still have to be
determined empirically, and it is quite easy to work with (10.2) as it is.
The dielectric properties of biological tissue result from the interaction of
electromagnetic radiation with its constituents at the cellular and molecular level.
The mechanisms of the interaction are well understood and discussed in the review
articles mentioned in [39]. Following [39], we can say that the main features of the
dielectric spectrum of biological tissue are as follows:
• The relative permittivity of a tissue may reach values of up to 10 6 or 10 7 at
frequencies below 100 Hz
• It decreases at high frequencies in three main steps known as the α, β, and γ
dispersions. Other dispersions may also be present.
• The γ dispersion, in the gigahertz region, is due to the polarization of water
molecules.
• The β dispersion, in the hundreds of kilohertz region, is due mainly to the
polarization of cellular membranes which act as barriers to the flow of ions
between the intra and extra cellular media. Other contributions to the β dispersion
come from the polarization of protein and other organic macromolecules.
• The low frequency α dispersion is associated with ionic diffusion processes at
the site of the cellular membrane.
• Tissues have finite ionic conductivities commensurate with the nature and extent
of their ionic content and ionic mobility.
Gabriel et al. [39–41] have tabulated the dielectric properties of tissues over the
frequency range 10 Hz to 20 GHz and have determined the Cole–Cole parameters
that cover the entire range of dispersions, and they are listed in Table 10.13.
Table 10.14 lists values of the conductivity and dielectric permittivity of a number
of biological tissues, using the data of Table 10.13.