

8.6 Results for the Anisotropic Double-Exponential Model
213
-0.0001
-5e-05
0
5e-05
0.0001
0.00015
0.0002
0
5
10
15
20
25
30
35
Sample functions for column 1 of m13m23
-5e-05
-4e-05
-3e-05
-2e-05
-1e-05
0
1e-05
2e-05
3e-05
4e-05
5e-05
6e-05
0
5
10
15
20
25
30
35
Sample functions for column 1 of m13m33
-0.00012
-0.0001
-8e-05
-6e-05
-4e-05
-2e-05
0
2e-05
4e-05
6e-05
8e-05
0.0001
480
485
490
495
500
505
510
515
Sample functions for column 16 of m13m23
-6e-05
-4e-05
-2e-05
0
2e-05
4e-05
6e-05
8e-05
0.0001
480
485
490
495
500
505
510
515
Sample functions for column 16 of m13m33
-0.00015
-0.0001
-5e-05
0
5e-05
0.0001
0.00015
990
995
1000 1005 1010 1015 1020 1025
Sample functions for column 32 of m13m23
-4e-05
-3e-05
-2e-05
-1e-05
0
1e-05
2e-05
3e-05
4e-05
5e-05
990
995
1000 1005 1010 1015 1020 1025
Sample functions for column 32 of m13m33
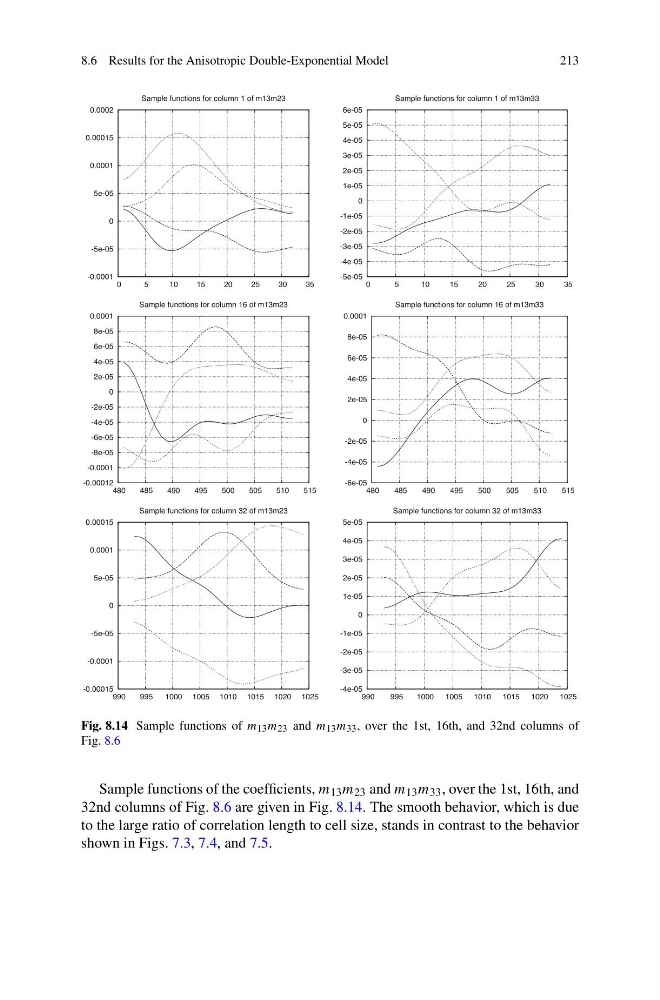
Fig. 8.14 Sample functions of m 13 m 23 and m 13 m 33 , over the 1st, 16th, and 32nd columns of
Fig. 8.6
Sample functions of the coefficients, m 13 m 23 and m 13 m 33 , over the 1st, 16th, and
32nd columns of Fig. 8.6 are given in Fig. 8.14. The smooth behavior, which is due
to the large ratio of correlation length to cell size, stands in contrast to the behavior
shown in Figs. 7.3, 7.4, and 7.5.
213
-0.0001
-5e-05
0
5e-05
0.0001
0.00015
0.0002
0
5
10
15
20
25
30
35
Sample functions for column 1 of m13m23
-5e-05
-4e-05
-3e-05
-2e-05
-1e-05
0
1e-05
2e-05
3e-05
4e-05
5e-05
6e-05
0
5
10
15
20
25
30
35
Sample functions for column 1 of m13m33
-0.00012
-0.0001
-8e-05
-6e-05
-4e-05
-2e-05
0
2e-05
4e-05
6e-05
8e-05
0.0001
480
485
490
495
500
505
510
515
Sample functions for column 16 of m13m23
-6e-05
-4e-05
-2e-05
0
2e-05
4e-05
6e-05
8e-05
0.0001
480
485
490
495
500
505
510
515
Sample functions for column 16 of m13m33
-0.00015
-0.0001
-5e-05
0
5e-05
0.0001
0.00015
990
995
1000 1005 1010 1015 1020 1025
Sample functions for column 32 of m13m23
-4e-05
-3e-05
-2e-05
-1e-05
0
1e-05
2e-05
3e-05
4e-05
5e-05
990
995
1000 1005 1010 1015 1020 1025
Sample functions for column 32 of m13m33
Fig. 8.14 Sample functions of m 13 m 23 and m 13 m 33 , over the 1st, 16th, and 32nd columns of
Fig. 8.6
Sample functions of the coefficients, m 13 m 23 and m 13 m 33 , over the 1st, 16th, and
32nd columns of Fig. 8.6 are given in Fig. 8.14. The smooth behavior, which is due
to the large ratio of correlation length to cell size, stands in contrast to the behavior
shown in Figs. 7.3, 7.4, and 7.5.