

7.11 Consistency of Calculations
191
0
0.1
0.2
0.3
0.4
0.5
0.6
0.7
0.8
0.9
1
0.02 0.04 0.06 0.08 0.1 0.12 0.14 0.16 0.18 0.2 0.22
Minimum Certainty
Threshold
Minimum Certainty vs Threshold at Two Scan Positions
0mm
1.625mm
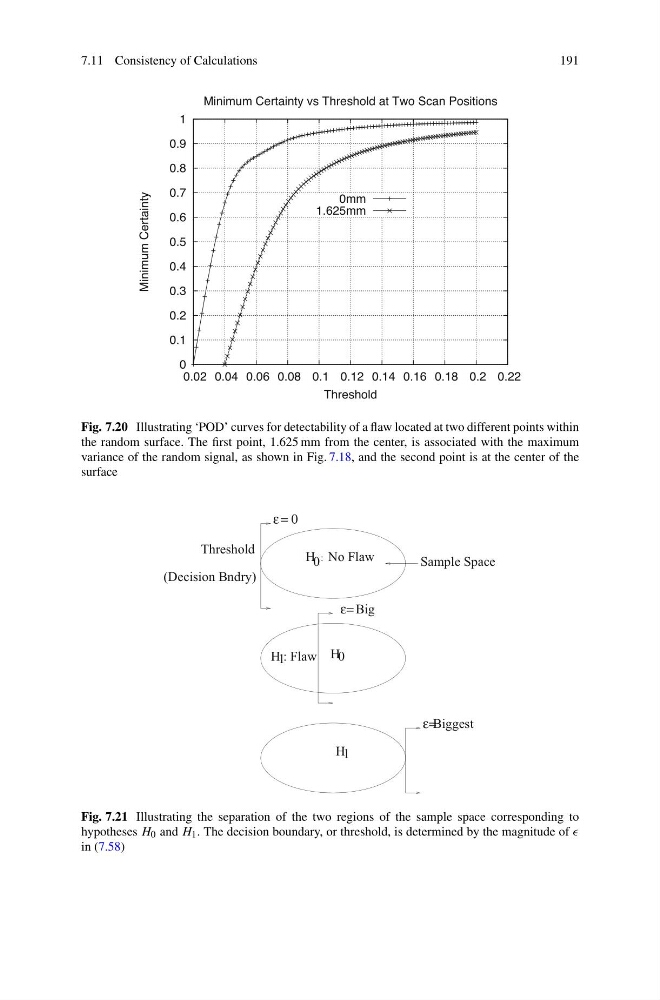
Fig. 7.20 Illustrating ‘POD’ curves for detectability of a flaw located at two different points within
the random surface. The first point, 1.625 mm from the center, is associated with the maximum
variance of the random signal, as shown in Fig. 7.18, and the second point is at the center of the
surface
Sample Space
:
ε = 0
H No Flaw
H 1 : Flaw H 0
H 1
ε=Biggest
Threshold
(Decision Bndry)
0
Big
ε=
Fig. 7.21 Illustrating the separation of the two regions of the sample space corresponding to
hypotheses H 0 and H 1 . The decision boundary, or threshold, is determined by the magnitude of
in (7.58)
191
0
0.1
0.2
0.3
0.4
0.5
0.6
0.7
0.8
0.9
1
0.02 0.04 0.06 0.08 0.1 0.12 0.14 0.16 0.18 0.2 0.22
Minimum Certainty
Threshold
Minimum Certainty vs Threshold at Two Scan Positions
0mm
1.625mm
Fig. 7.20 Illustrating ‘POD’ curves for detectability of a flaw located at two different points within
the random surface. The first point, 1.625 mm from the center, is associated with the maximum
variance of the random signal, as shown in Fig. 7.18, and the second point is at the center of the
surface
Sample Space
:
ε = 0
H No Flaw
H 1 : Flaw H 0
H 1
ε=Biggest
Threshold
(Decision Bndry)
0
Big
ε=
Fig. 7.21 Illustrating the separation of the two regions of the sample space corresponding to
hypotheses H 0 and H 1 . The decision boundary, or threshold, is determined by the magnitude of
in (7.58)