

7.10 Probability of Detection and the Chebychev Inequality
189
0
0.0002
0.0004
0.0006
0.0008
0.001
0.0012
0.0014
0.0016
-4
-3
-2
-1
0
1
2
3
4
Scan position (mm)
Total Variance of 1D and 2D Functions
R
X
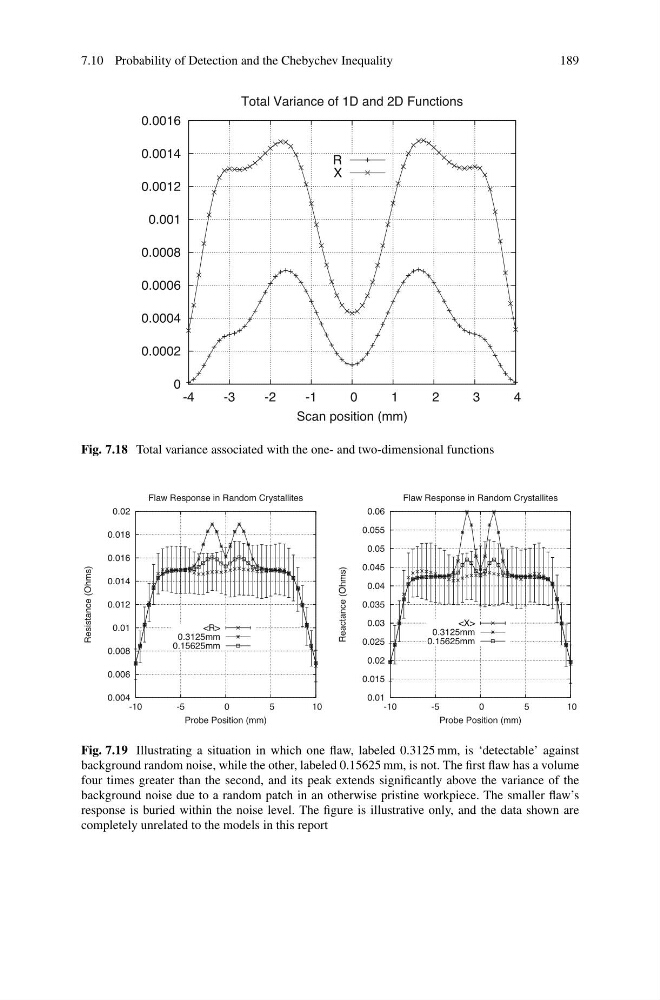
Fig. 7.18 Total variance associated with the one- and two-dimensional functions
0.004
0.006
0.008
0.01
0.012
0.014
0.016
0.018
0.02
-10
-5
0
5
10
Resistance (Ohms)
Probe Position (mm)
Flaw Response in Random Crystallites
0.3125mm
0.15625mm
0.01
0.015
0.02
0.025
0.03
0.035
0.04
0.045
0.05
0.055
0.06
-10
-5
0
5
10
Reactance (Ohms)
Probe Position (mm)
Flaw Response in Random Crystallites
0.3125mm
0.15625mm
Fig. 7.19 Illustrating a situation in which one flaw, labeled 0.3125 mm, is ‘detectable’ against
background random noise, while the other, labeled 0.15625 mm, is not. The first flaw has a volume
four times greater than the second, and its peak extends significantly above the variance of the
background noise due to a random patch in an otherwise pristine workpiece. The smaller flaw’s
response is buried within the noise level. The figure is illustrative only, and the data shown are
completely unrelated to the models in this report
189
0
0.0002
0.0004
0.0006
0.0008
0.001
0.0012
0.0014
0.0016
-4
-3
-2
-1
0
1
2
3
4
Scan position (mm)
Total Variance of 1D and 2D Functions
R
X
Fig. 7.18 Total variance associated with the one- and two-dimensional functions
0.004
0.006
0.008
0.01
0.012
0.014
0.016
0.018
0.02
-10
-5
0
5
10
Resistance (Ohms)
Probe Position (mm)
Flaw Response in Random Crystallites
0.3125mm
0.15625mm
0.01
0.015
0.02
0.025
0.03
0.035
0.04
0.045
0.05
0.055
0.06
-10
-5
0
5
10
Reactance (Ohms)
Probe Position (mm)
Flaw Response in Random Crystallites
0.3125mm
0.15625mm
Fig. 7.19 Illustrating a situation in which one flaw, labeled 0.3125 mm, is ‘detectable’ against
background random noise, while the other, labeled 0.15625 mm, is not. The first flaw has a volume
four times greater than the second, and its peak extends significantly above the variance of the
background noise due to a random patch in an otherwise pristine workpiece. The smaller flaw’s
response is buried within the noise level. The figure is illustrative only, and the data shown are
completely unrelated to the models in this report