

4.6 Advanced Features for Set-Theoretic Microstructure Quantification
111
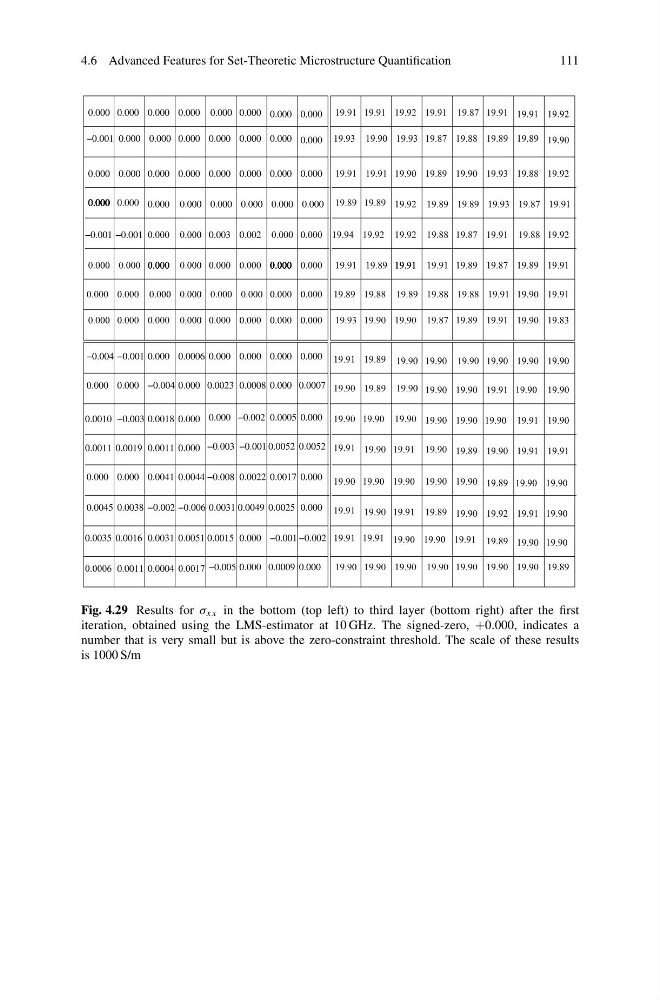
Fig. 4.29 Results for σ xx in the bottom (top left) to third layer (bottom right) after the first
iteration, obtained using the LMS-estimator at 10 GHz. The signed-zero, +0.000, indicates a
number that is very small but is above the zero-constraint threshold. The scale of these results
is 1000 S/m
111
Fig. 4.29 Results for σ xx in the bottom (top left) to third layer (bottom right) after the first
iteration, obtained using the LMS-estimator at 10 GHz. The signed-zero, +0.000, indicates a
number that is very small but is above the zero-constraint threshold. The scale of these results
is 1000 S/m