

2 Bio-microelectromechanical Systems (BioMEMS) …
43
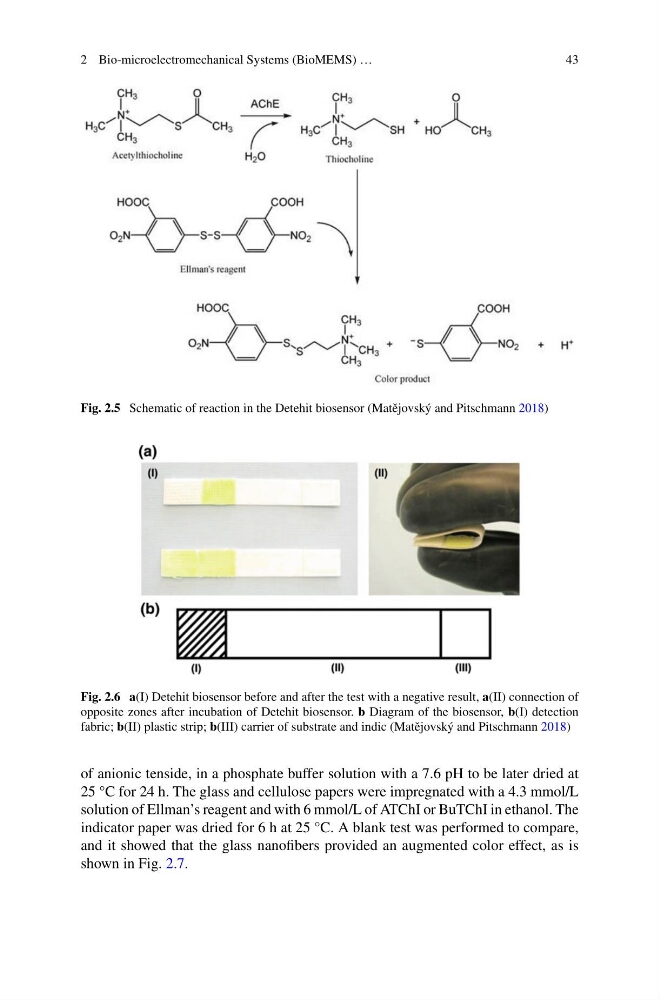
Fig. 2.5 Schematic of reaction in the Detehit biosensor (Matˇ ejovský and Pitschmann 2018)
Fig. 2.6 a(I) Detehit biosensor before and after the test with a negative result, a(II) connection of
opposite zones after incubation of Detehit biosensor. b Diagram of the biosensor, b(I) detection
fabric; b(II) plastic strip; b(III) carrier of substrate and indic (Matˇ ejovský and Pitschmann 2018)
of anionic tenside, in a phosphate buffer solution with a 7.6 pH to be later dried at
25 °C for 24 h. The glass and cellulose papers were impregnated with a 4.3 mmol/L
solution of Ellman’s reagent and with 6 mmol/L of ATChI or BuTChI in ethanol. The
indicator paper was dried for 6 h at 25 °C. A blank test was performed to compare,
and it showed that the glass nanofibers provided an augmented color effect, as is
shown in Fig. 2.7.
43
Fig. 2.5 Schematic of reaction in the Detehit biosensor (Matˇ ejovský and Pitschmann 2018)
Fig. 2.6 a(I) Detehit biosensor before and after the test with a negative result, a(II) connection of
opposite zones after incubation of Detehit biosensor. b Diagram of the biosensor, b(I) detection
fabric; b(II) plastic strip; b(III) carrier of substrate and indic (Matˇ ejovský and Pitschmann 2018)
of anionic tenside, in a phosphate buffer solution with a 7.6 pH to be later dried at
25 °C for 24 h. The glass and cellulose papers were impregnated with a 4.3 mmol/L
solution of Ellman’s reagent and with 6 mmol/L of ATChI or BuTChI in ethanol. The
indicator paper was dried for 6 h at 25 °C. A blank test was performed to compare,
and it showed that the glass nanofibers provided an augmented color effect, as is
shown in Fig. 2.7.