

3 Bio-microelectromechanical Systems (BioMEMS) in Bio-sensing …
87
components. To keep the effect of this increased temperature at negligible levels, the
OLED was fed 9 V through a variable DC voltage source. Lower levels of LOD was
achieved when the antibody was diluted 5 times the original concentration (2 µg/mL),
that corresponded to a 1:1 ratio between the antigen and the secondary antibody. No
relevant fluorescence was detected by the spectrometer after this point. The saturated
sample with high concentration of biomolecules does not promote efficient binding
between antigens and antibodies due to the possibility of steric repulsion. Despite the
advantages of fluorescence-based biosensors utilizing an OLED, certain applications
have design requirements that may place this as a suboptimal option.
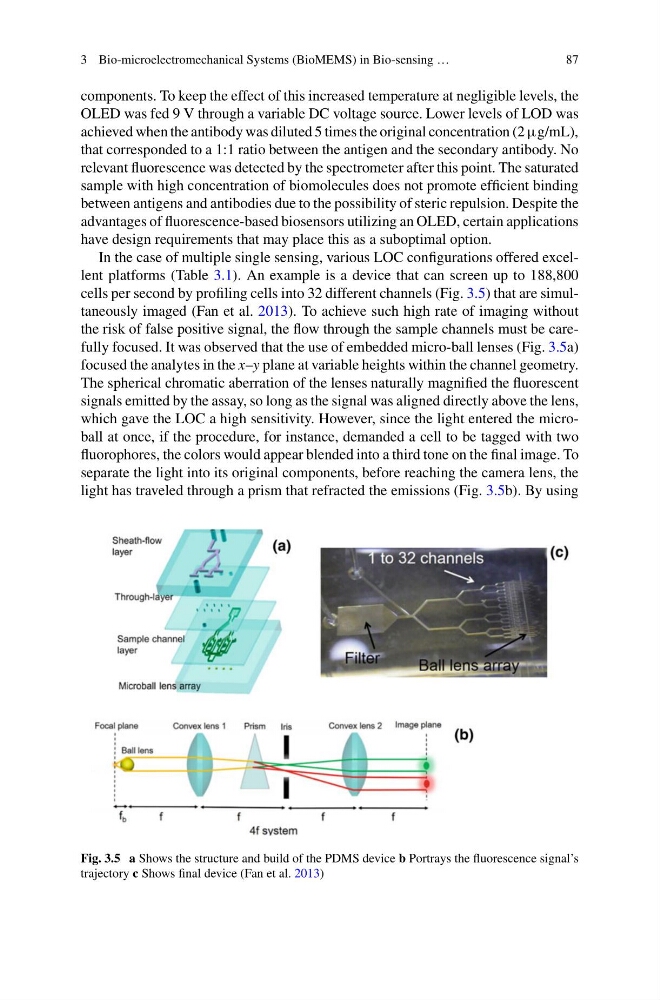
In the case of multiple single sensing, various LOC configurations offered excellent platforms (Table 3.1). An example is a device that can screen up to 188,800
cells per second by profiling cells into 32 different channels (Fig. 3.5) that are simultaneously imaged (Fan et al. 2013). To achieve such high rate of imaging without
the risk of false positive signal, the flow through the sample channels must be carefully focused. It was observed that the use of embedded micro-ball lenses (Fig. 3.5a)
focused the analytes in the x–y plane at variable heights within the channel geometry.
The spherical chromatic aberration of the lenses naturally magnified the fluorescent
signals emitted by the assay, so long as the signal was aligned directly above the lens,
which gave the LOC a high sensitivity. However, since the light entered the microball at once, if the procedure, for instance, demanded a cell to be tagged with two
fluorophores, the colors would appear blended into a third tone on the final image. To
separate the light into its original components, before reaching the camera lens, the
light has traveled through a prism that refracted the emissions (Fig. 3.5b). By using
Fig. 3.5 a Shows the structure and build of the PDMS device b Portrays the fluorescence signal’s
trajectory c Shows final device (Fan et al. 2013)
87
components. To keep the effect of this increased temperature at negligible levels, the
OLED was fed 9 V through a variable DC voltage source. Lower levels of LOD was
achieved when the antibody was diluted 5 times the original concentration (2 µg/mL),
that corresponded to a 1:1 ratio between the antigen and the secondary antibody. No
relevant fluorescence was detected by the spectrometer after this point. The saturated
sample with high concentration of biomolecules does not promote efficient binding
between antigens and antibodies due to the possibility of steric repulsion. Despite the
advantages of fluorescence-based biosensors utilizing an OLED, certain applications
have design requirements that may place this as a suboptimal option.
In the case of multiple single sensing, various LOC configurations offered excellent platforms (Table 3.1). An example is a device that can screen up to 188,800
cells per second by profiling cells into 32 different channels (Fig. 3.5) that are simultaneously imaged (Fan et al. 2013). To achieve such high rate of imaging without
the risk of false positive signal, the flow through the sample channels must be carefully focused. It was observed that the use of embedded micro-ball lenses (Fig. 3.5a)
focused the analytes in the x–y plane at variable heights within the channel geometry.
The spherical chromatic aberration of the lenses naturally magnified the fluorescent
signals emitted by the assay, so long as the signal was aligned directly above the lens,
which gave the LOC a high sensitivity. However, since the light entered the microball at once, if the procedure, for instance, demanded a cell to be tagged with two
fluorophores, the colors would appear blended into a third tone on the final image. To
separate the light into its original components, before reaching the camera lens, the
light has traveled through a prism that refracted the emissions (Fig. 3.5b). By using
Fig. 3.5 a Shows the structure and build of the PDMS device b Portrays the fluorescence signal’s
trajectory c Shows final device (Fan et al. 2013)