

80
4 Scalable Interdigitated Photoconductive Emitters for the Electrical …
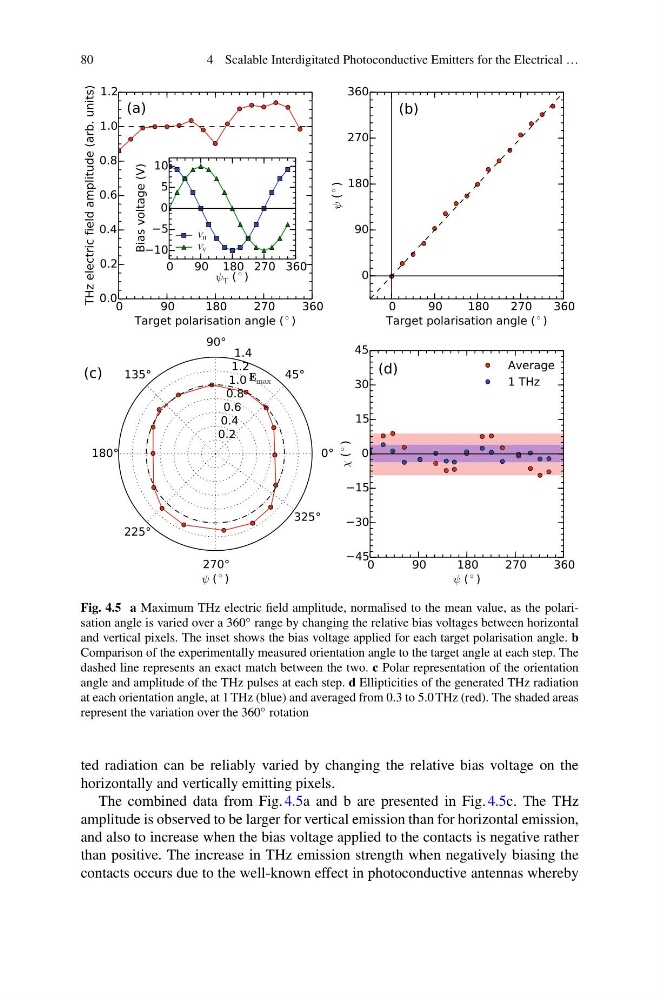
Fig. 4.5 a Maximum THz electric field amplitude, normalised to the mean value, as the polarisation angle is varied over a 360 ◦ range by changing the relative bias voltages between horizontal
and vertical pixels. The inset shows the bias voltage applied for each target polarisation angle. b
Comparison of the experimentally measured orientation angle to the target angle at each step. The
dashed line represents an exact match between the two. c Polar representation of the orientation
angle and amplitude of the THz pulses at each step. d Ellipticities of the generated THz radiation
at each orientation angle, at 1 THz (blue) and averaged from 0.3 to 5.0 THz (red). The shaded areas
represent the variation over the 360 ◦ rotation
ted radiation can be reliably varied by changing the relative bias voltage on the
horizontally and vertically emitting pixels.
The combined data from Fig. 4.5a and b are presented in Fig. 4.5c. The THz
amplitude is observed to be larger for vertical emission than for horizontal emission,
and also to increase when the bias voltage applied to the contacts is negative rather
than positive. The increase in THz emission strength when negatively biasing the
contacts occurs due to the well-known effect in photoconductive antennas whereby
4 Scalable Interdigitated Photoconductive Emitters for the Electrical …
Fig. 4.5 a Maximum THz electric field amplitude, normalised to the mean value, as the polarisation angle is varied over a 360 ◦ range by changing the relative bias voltages between horizontal
and vertical pixels. The inset shows the bias voltage applied for each target polarisation angle. b
Comparison of the experimentally measured orientation angle to the target angle at each step. The
dashed line represents an exact match between the two. c Polar representation of the orientation
angle and amplitude of the THz pulses at each step. d Ellipticities of the generated THz radiation
at each orientation angle, at 1 THz (blue) and averaged from 0.3 to 5.0 THz (red). The shaded areas
represent the variation over the 360 ◦ rotation
ted radiation can be reliably varied by changing the relative bias voltage on the
horizontally and vertically emitting pixels.
The combined data from Fig. 4.5a and b are presented in Fig. 4.5c. The THz
amplitude is observed to be larger for vertical emission than for horizontal emission,
and also to increase when the bias voltage applied to the contacts is negative rather
than positive. The increase in THz emission strength when negatively biasing the
contacts occurs due to the well-known effect in photoconductive antennas whereby