

5.3 A Test Case of Nonlinear THz Transmission: Indium Antimonide
101
GaAs was observed to reduce monotonically with increasing electric field strength,
without saturation, up to fields of 150 kVcm
−1 .
The following section will utilise this effect in InSb as a test of the high-field THzTDS system outlined in Sect. 5.2, to ensure it operates as intended, and to provide
context for the results presented in Sects. 5.4 and 5.5.
5.3.1 Experimental Results
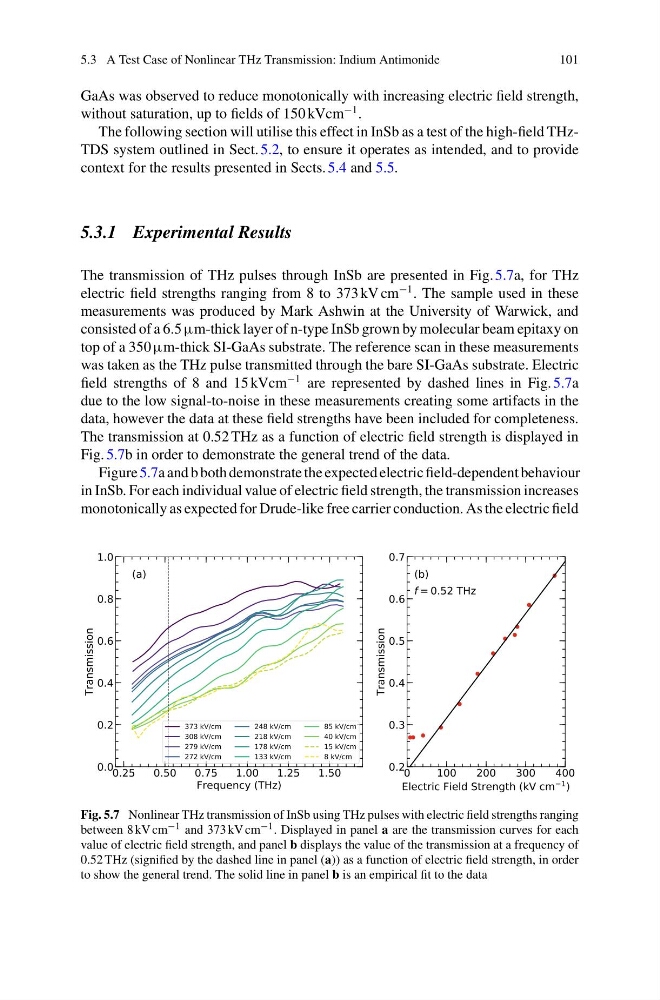
The transmission of THz pulses through InSb are presented in Fig. 5.7a, for THz
electric field strengths ranging from 8 to 373 kV cm
−1 . The sample used in these
measurements was produced by Mark Ashwin at the University of Warwick, and
consisted of a 6.5 µm-thick layer of n-type InSb grown by molecular beam epitaxy on
top of a 350 µm-thick SI-GaAs substrate. The reference scan in these measurements
was taken as the THz pulse transmitted through the bare SI-GaAs substrate. Electric
field strengths of 8 and 15 kVcm
−1 are represented by dashed lines in Fig. 5.7a
due to the low signal-to-noise in these measurements creating some artifacts in the
data, however the data at these field strengths have been included for completeness.
The transmission at 0.52 THz as a function of electric field strength is displayed in
Fig. 5.7b in order to demonstrate the general trend of the data.
Figure 5.7a and b both demonstrate the expected electric field-dependent behaviour
in InSb. For each individual value of electric field strength, the transmission increases
monotonically as expected for Drude-like free carrier conduction. As the electric field
Fig. 5.7 Nonlinear THz transmission of InSb using THz pulses with electric field strengths ranging
between 8 kV cm −1 and 373 kV cm −1 . Displayed in panel a are the transmission curves for each
value of electric field strength, and panel b displays the value of the transmission at a frequency of
0.52 THz (signified by the dashed line in panel (a)) as a function of electric field strength, in order
to show the general trend. The solid line in panel b is an empirical fit to the data
101
GaAs was observed to reduce monotonically with increasing electric field strength,
without saturation, up to fields of 150 kVcm
−1 .
The following section will utilise this effect in InSb as a test of the high-field THzTDS system outlined in Sect. 5.2, to ensure it operates as intended, and to provide
context for the results presented in Sects. 5.4 and 5.5.
5.3.1 Experimental Results
The transmission of THz pulses through InSb are presented in Fig. 5.7a, for THz
electric field strengths ranging from 8 to 373 kV cm
−1 . The sample used in these
measurements was produced by Mark Ashwin at the University of Warwick, and
consisted of a 6.5 µm-thick layer of n-type InSb grown by molecular beam epitaxy on
top of a 350 µm-thick SI-GaAs substrate. The reference scan in these measurements
was taken as the THz pulse transmitted through the bare SI-GaAs substrate. Electric
field strengths of 8 and 15 kVcm
−1 are represented by dashed lines in Fig. 5.7a
due to the low signal-to-noise in these measurements creating some artifacts in the
data, however the data at these field strengths have been included for completeness.
The transmission at 0.52 THz as a function of electric field strength is displayed in
Fig. 5.7b in order to demonstrate the general trend of the data.
Figure 5.7a and b both demonstrate the expected electric field-dependent behaviour
in InSb. For each individual value of electric field strength, the transmission increases
monotonically as expected for Drude-like free carrier conduction. As the electric field
Fig. 5.7 Nonlinear THz transmission of InSb using THz pulses with electric field strengths ranging
between 8 kV cm −1 and 373 kV cm −1 . Displayed in panel a are the transmission curves for each
value of electric field strength, and panel b displays the value of the transmission at a frequency of
0.52 THz (signified by the dashed line in panel (a)) as a function of electric field strength, in order
to show the general trend. The solid line in panel b is an empirical fit to the data