

et al. 2014). The main objectives were (a) to investigate the
GHGs transport mechanisms pertaining to the Indian subcontinent, (b) to understand the causes behind the seasonality of atmospheric CO 2 concentrations and (c) to develop a
modeling framework (forward and inverse) for estimations
of carbon sources and sinks over the Indian domain.
Among other studies, significant effort was made by the
CSIR Fourth Paradigm Institute, Bengaluru (formerly CSIR
Centre for Mathematical Modeling and Computer Simulation), in collaboration with a few other national and international research organizations, such as Laboratoire des
sciences du climat et de l’environnement (LSCE) in Paris,
France; National Institute of Ocean Technology in Chennai
and Port Blair; and Indian Institute of Astrophysics, Bengaluru. Scientists from these institutes reported GHGs
monitoring results at three sites Hanle (32.78° N, 78.96° E,
4500 m ASL), Pondicherry (11.91° N, 79.81° E, 6 m ASL)
and Port Blair (11.62° N, 92.72° E, 17 m ASL) during the
period 2007–2011 (Lin et al. 2015). Hanle is a high-altitude
site and is considered as northern hemispheric midlatitude
representative location. Pondicherry and Port Blair are
coastal and oceanic sites, respectively, located at similar
latitudes. Measurements were based on weekly flask sampling, and the flask samples were analyzed at the LSCE,
France, under the Indo-French collaborative project. The
observed concentration of CH 4 at Hanle peaked during the
summer monsoon months, in contrast to the seasonal cycle at
other sites including Pondicherry and Port Blair. High CH 4
concentration during monsoon could be due to enhanced
biogenic emissions from wetlands and rice fields.
Sreenivas et al. (2016) presented CO 2 and CH 4 measurements over Shadnagar (17.03° N, 78°18 E) at Telangana
India. But unlike the Hanle observations, these authors
found minimum CH 4 during Indian summer monsoon and
maximum during post-monsoon, indicating spatial heterogeneity in methane emissions and hence concentrations
across the country. Maximum CO 2 occurred during
pre-monsoon in conformity with the other observations, such
as SNG (Tiwari et al. 2014; Metya et al. 2020). The Physical
Research Laboratory in Ahmedabad has also made significant contributions in this regard, especially in analyzing the
GHGs dynamics in an urban environment of India. For
example, Chandra et al. (2019) observed low concentration
of CO 2 at Ahmedabad during the monsoon season in conformity with the result obtained by Tiwari et al. (2014) for
the Sinhagad station.
4.2.1 Carbon Dioxide (CO 2 )
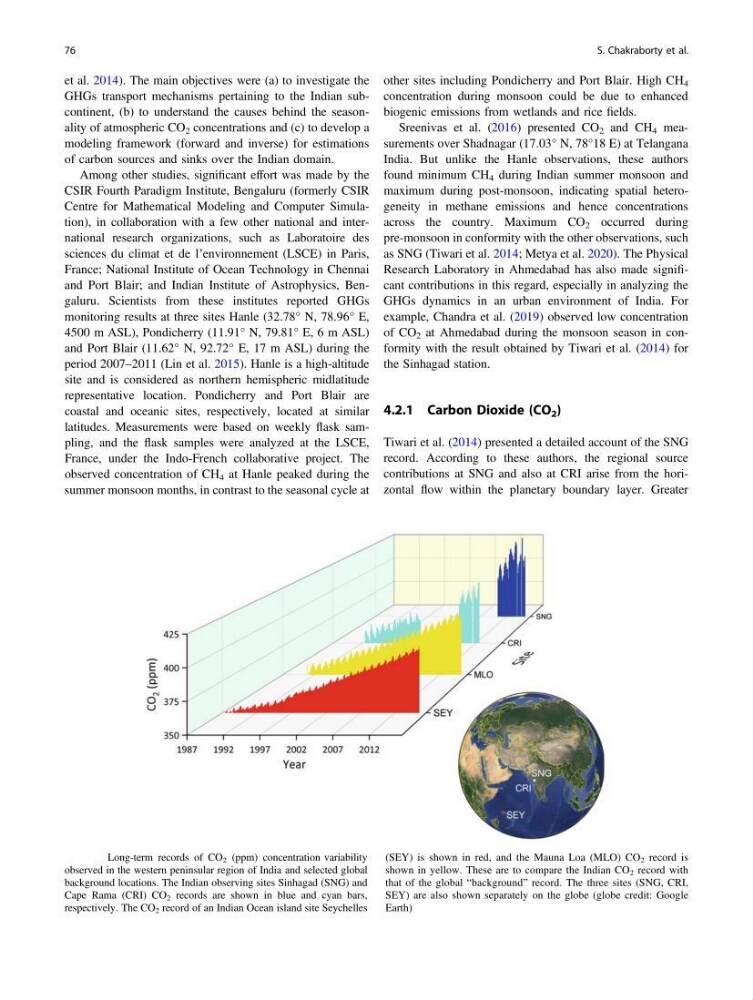
Tiwari et al. (2014) presented a detailed account of the SNG
record. According to these authors, the regional source
contributions at SNG and also at CRI arise from the horizontal flow within the planetary boundary layer. Greater
Fig. 4.2 Long-term records of CO 2 (ppm) concentration variability
observed in the western peninsular region of India and selected global
background locations. The Indian observing sites Sinhagad (SNG) and
Cape Rama (CRI) CO 2 records are shown in blue and cyan bars,
respectively. The CO 2 record of an Indian Ocean island site Seychelles
(SEY) is shown in red, and the Mauna Loa (MLO) CO 2 record is
shown in yellow. These are to compare the Indian CO 2 record with
that of the global “background” record. The three sites (SNG, CRI,
SEY) are also shown separately on the globe (globe credit: Google
Earth)
76
S. Chakraborty et al.
GHGs transport mechanisms pertaining to the Indian subcontinent, (b) to understand the causes behind the seasonality of atmospheric CO 2 concentrations and (c) to develop a
modeling framework (forward and inverse) for estimations
of carbon sources and sinks over the Indian domain.
Among other studies, significant effort was made by the
CSIR Fourth Paradigm Institute, Bengaluru (formerly CSIR
Centre for Mathematical Modeling and Computer Simulation), in collaboration with a few other national and international research organizations, such as Laboratoire des
sciences du climat et de l’environnement (LSCE) in Paris,
France; National Institute of Ocean Technology in Chennai
and Port Blair; and Indian Institute of Astrophysics, Bengaluru. Scientists from these institutes reported GHGs
monitoring results at three sites Hanle (32.78° N, 78.96° E,
4500 m ASL), Pondicherry (11.91° N, 79.81° E, 6 m ASL)
and Port Blair (11.62° N, 92.72° E, 17 m ASL) during the
period 2007–2011 (Lin et al. 2015). Hanle is a high-altitude
site and is considered as northern hemispheric midlatitude
representative location. Pondicherry and Port Blair are
coastal and oceanic sites, respectively, located at similar
latitudes. Measurements were based on weekly flask sampling, and the flask samples were analyzed at the LSCE,
France, under the Indo-French collaborative project. The
observed concentration of CH 4 at Hanle peaked during the
summer monsoon months, in contrast to the seasonal cycle at
other sites including Pondicherry and Port Blair. High CH 4
concentration during monsoon could be due to enhanced
biogenic emissions from wetlands and rice fields.
Sreenivas et al. (2016) presented CO 2 and CH 4 measurements over Shadnagar (17.03° N, 78°18 E) at Telangana
India. But unlike the Hanle observations, these authors
found minimum CH 4 during Indian summer monsoon and
maximum during post-monsoon, indicating spatial heterogeneity in methane emissions and hence concentrations
across the country. Maximum CO 2 occurred during
pre-monsoon in conformity with the other observations, such
as SNG (Tiwari et al. 2014; Metya et al. 2020). The Physical
Research Laboratory in Ahmedabad has also made significant contributions in this regard, especially in analyzing the
GHGs dynamics in an urban environment of India. For
example, Chandra et al. (2019) observed low concentration
of CO 2 at Ahmedabad during the monsoon season in conformity with the result obtained by Tiwari et al. (2014) for
the Sinhagad station.
4.2.1 Carbon Dioxide (CO 2 )
Tiwari et al. (2014) presented a detailed account of the SNG
record. According to these authors, the regional source
contributions at SNG and also at CRI arise from the horizontal flow within the planetary boundary layer. Greater
Fig. 4.2 Long-term records of CO 2 (ppm) concentration variability
observed in the western peninsular region of India and selected global
background locations. The Indian observing sites Sinhagad (SNG) and
Cape Rama (CRI) CO 2 records are shown in blue and cyan bars,
respectively. The CO 2 record of an Indian Ocean island site Seychelles
(SEY) is shown in red, and the Mauna Loa (MLO) CO 2 record is
shown in yellow. These are to compare the Indian CO 2 record with
that of the global “background” record. The three sites (SNG, CRI,
SEY) are also shown separately on the globe (globe credit: Google
Earth)
76
S. Chakraborty et al.