

Key Messages
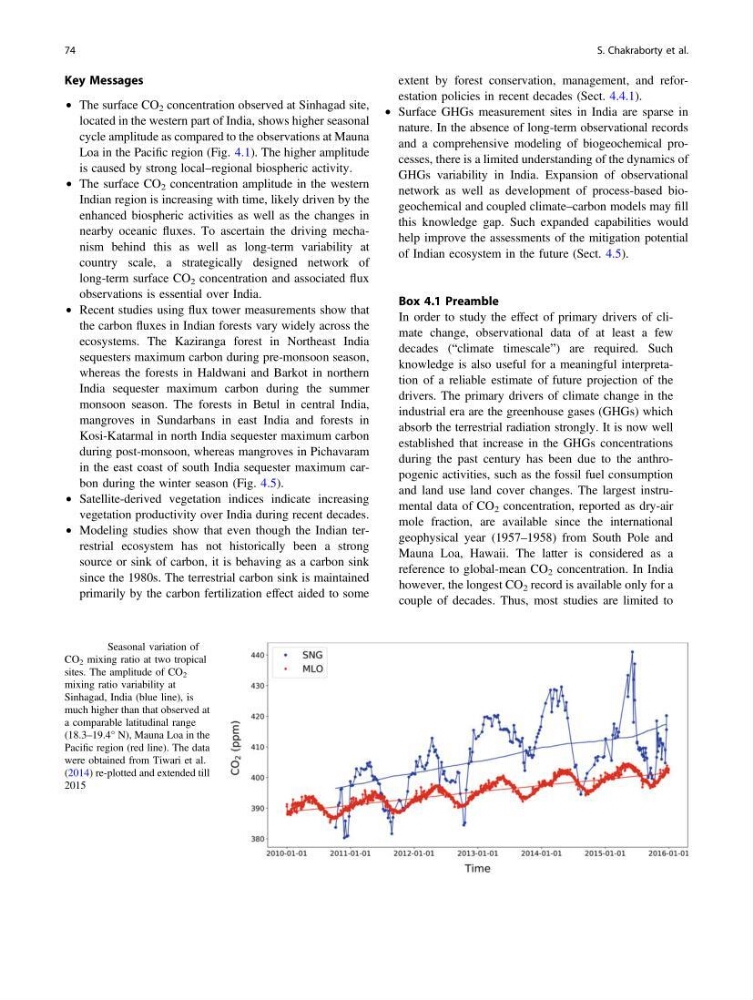
• The surface CO 2 concentration observed at Sinhagad site,
located in the western part of India, shows higher seasonal
cycle amplitude as compared to the observations at Mauna
Loa in the Pacific region (Fig. 4.1). The higher amplitude
is caused by strong local–regional biospheric activity.
• The surface CO 2 concentration amplitude in the western
Indian region is increasing with time, likely driven by the
enhanced biospheric activities as well as the changes in
nearby oceanic fluxes. To ascertain the driving mechanism behind this as well as long-term variability at
country scale, a strategically designed network of
long-term surface CO 2 concentration and associated flux
observations is essential over India.
• Recent studies using flux tower measurements show that
the carbon fluxes in Indian forests vary widely across the
ecosystems. The Kaziranga forest in Northeast India
sequesters maximum carbon during pre-monsoon season,
whereas the forests in Haldwani and Barkot in northern
India sequester maximum carbon during the summer
monsoon season. The forests in Betul in central India,
mangroves in Sundarbans in east India and forests in
Kosi-Katarmal in north India sequester maximum carbon
during post-monsoon, whereas mangroves in Pichavaram
in the east coast of south India sequester maximum carbon during the winter season (Fig. 4.5).
• Satellite-derived vegetation indices indicate increasing
vegetation productivity over India during recent decades.
• Modeling studies show that even though the Indian terrestrial ecosystem has not historically been a strong
source or sink of carbon, it is behaving as a carbon sink
since the 1980s. The terrestrial carbon sink is maintained
primarily by the carbon fertilization effect aided to some
extent by forest conservation, management, and reforestation policies in recent decades (Sect. 4.4.1).
• Surface GHGs measurement sites in India are sparse in
nature. In the absence of long-term observational records
and a comprehensive modeling of biogeochemical processes, there is a limited understanding of the dynamics of
GHGs variability in India. Expansion of observational
network as well as development of process-based biogeochemical and coupled climate–carbon models may fill
this knowledge gap. Such expanded capabilities would
help improve the assessments of the mitigation potential
of Indian ecosystem in the future (Sect. 4.5).
Box 4.1 Preamble
In order to study the effect of primary drivers of climate change, observational data of at least a few
decades (“climate timescale”) are required. Such
knowledge is also useful for a meaningful interpretation of a reliable estimate of future projection of the
drivers. The primary drivers of climate change in the
industrial era are the greenhouse gases (GHGs) which
absorb the terrestrial radiation strongly. It is now well
established that increase in the GHGs concentrations
during the past century has been due to the anthropogenic activities, such as the fossil fuel consumption
and land use land cover changes. The largest instrumental data of CO 2 concentration, reported as dry-air
mole fraction, are available since the international
geophysical year (1957–1958) from South Pole and
Mauna Loa, Hawaii. The latter is considered as a
reference to global-mean CO 2 concentration. In India
however, the longest CO 2 record is available only for a
couple of decades. Thus, most studies are limited to
Fig. 4.1 Seasonal variation of
CO 2 mixing ratio at two tropical
sites. The amplitude of CO 2
mixing ratio variability at
Sinhagad, India (blue line), is
much higher than that observed at
a comparable latitudinal range
(18.3–19.4° N), Mauna Loa in the
Pacific region (red line). The data
were obtained from Tiwari et al.
(2014) re-plotted and extended till
2015
74
S. Chakraborty et al.
• The surface CO 2 concentration observed at Sinhagad site,
located in the western part of India, shows higher seasonal
cycle amplitude as compared to the observations at Mauna
Loa in the Pacific region (Fig. 4.1). The higher amplitude
is caused by strong local–regional biospheric activity.
• The surface CO 2 concentration amplitude in the western
Indian region is increasing with time, likely driven by the
enhanced biospheric activities as well as the changes in
nearby oceanic fluxes. To ascertain the driving mechanism behind this as well as long-term variability at
country scale, a strategically designed network of
long-term surface CO 2 concentration and associated flux
observations is essential over India.
• Recent studies using flux tower measurements show that
the carbon fluxes in Indian forests vary widely across the
ecosystems. The Kaziranga forest in Northeast India
sequesters maximum carbon during pre-monsoon season,
whereas the forests in Haldwani and Barkot in northern
India sequester maximum carbon during the summer
monsoon season. The forests in Betul in central India,
mangroves in Sundarbans in east India and forests in
Kosi-Katarmal in north India sequester maximum carbon
during post-monsoon, whereas mangroves in Pichavaram
in the east coast of south India sequester maximum carbon during the winter season (Fig. 4.5).
• Satellite-derived vegetation indices indicate increasing
vegetation productivity over India during recent decades.
• Modeling studies show that even though the Indian terrestrial ecosystem has not historically been a strong
source or sink of carbon, it is behaving as a carbon sink
since the 1980s. The terrestrial carbon sink is maintained
primarily by the carbon fertilization effect aided to some
extent by forest conservation, management, and reforestation policies in recent decades (Sect. 4.4.1).
• Surface GHGs measurement sites in India are sparse in
nature. In the absence of long-term observational records
and a comprehensive modeling of biogeochemical processes, there is a limited understanding of the dynamics of
GHGs variability in India. Expansion of observational
network as well as development of process-based biogeochemical and coupled climate–carbon models may fill
this knowledge gap. Such expanded capabilities would
help improve the assessments of the mitigation potential
of Indian ecosystem in the future (Sect. 4.5).
Box 4.1 Preamble
In order to study the effect of primary drivers of climate change, observational data of at least a few
decades (“climate timescale”) are required. Such
knowledge is also useful for a meaningful interpretation of a reliable estimate of future projection of the
drivers. The primary drivers of climate change in the
industrial era are the greenhouse gases (GHGs) which
absorb the terrestrial radiation strongly. It is now well
established that increase in the GHGs concentrations
during the past century has been due to the anthropogenic activities, such as the fossil fuel consumption
and land use land cover changes. The largest instrumental data of CO 2 concentration, reported as dry-air
mole fraction, are available since the international
geophysical year (1957–1958) from South Pole and
Mauna Loa, Hawaii. The latter is considered as a
reference to global-mean CO 2 concentration. In India
however, the longest CO 2 record is available only for a
couple of decades. Thus, most studies are limited to
Fig. 4.1 Seasonal variation of
CO 2 mixing ratio at two tropical
sites. The amplitude of CO 2
mixing ratio variability at
Sinhagad, India (blue line), is
much higher than that observed at
a comparable latitudinal range
(18.3–19.4° N), Mauna Loa in the
Pacific region (red line). The data
were obtained from Tiwari et al.
(2014) re-plotted and extended till
2015
74
S. Chakraborty et al.