

mum (nighttime) temperatures are above the 90th (warm) or
below the 10th (cold) percentile (see more details in
Box 2.2).
Box 2.2 Frequency and Intensity Indices of Daily
Temperature Extremes
The all India averaged annual frequency and intensity
indices of daily extreme temperatures observed over
India during the periods 1951–2015 and 1986–2015
are estimated using the IMD daily maximum and
minimum surface air temperature gridded datasets.
The percentile indices representing the occurrence of
cold nights (TN10p), cold days (TX10p), warm nights
(TN90p) and warm days (TX90p) are defined following Zhang et al. (2011), and describe the threshold
exceedance rate of days where daily minimum or daily
maximum temperature is below the 10th or above the
90th percentile, respectively. The thresholds are based
on the annual cycle of the percentiles calculated for a
5-day sliding window centered on each calendar day in
the base period 1951–1980. The absolute indices
representing the intensity of coldest night (TNn),
coldest day (TXn), warmest night (TNx) and warmest
day (TXx) are also defined following Zhang et al.
(2011), and are presented as annual anomalies from
the 1951–1980 climatological mean.
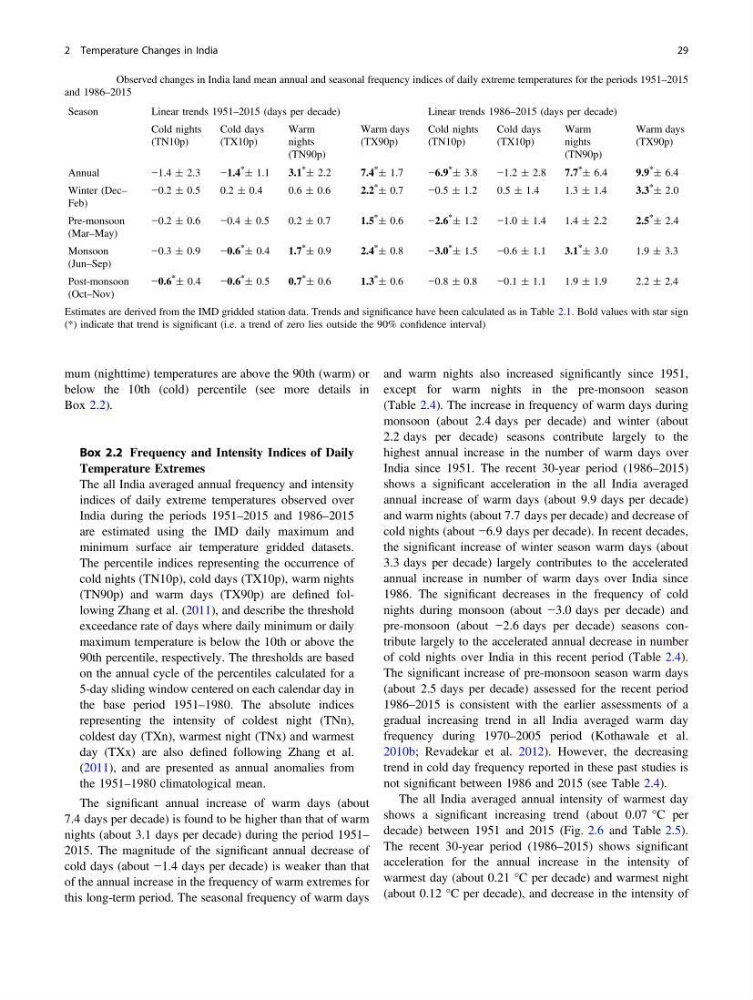
The significant annual increase of warm days (about
7.4 days per decade) is found to be higher than that of warm
nights (about 3.1 days per decade) during the period 1951–
2015. The magnitude of the significant annual decrease of
cold days (about −1.4 days per decade) is weaker than that
of the annual increase in the frequency of warm extremes for
this long-term period. The seasonal frequency of warm days
and warm nights also increased significantly since 1951,
except for warm nights in the pre-monsoon season
(Table 2.4). The increase in frequency of warm days during
monsoon (about 2.4 days per decade) and winter (about
2.2 days per decade) seasons contribute largely to the
highest annual increase in the number of warm days over
India since 1951. The recent 30-year period (1986–2015)
shows a significant acceleration in the all India averaged
annual increase of warm days (about 9.9 days per decade)
and warm nights (about 7.7 days per decade) and decrease of
cold nights (about −6.9 days per decade). In recent decades,
the significant increase of winter season warm days (about
3.3 days per decade) largely contributes to the accelerated
annual increase in number of warm days over India since
1986. The significant decreases in the frequency of cold
nights during monsoon (about −3.0 days per decade) and
pre-monsoon (about −2.6 days per decade) seasons contribute largely to the accelerated annual decrease in number
of cold nights over India in this recent period (Table 2.4).
The significant increase of pre-monsoon season warm days
(about 2.5 days per decade) assessed for the recent period
1986–2015 is consistent with the earlier assessments of a
gradual increasing trend in all India averaged warm day
frequency during 1970–2005 period (Kothawale et al.
2010b; Revadekar et al. 2012). However, the decreasing
trend in cold day frequency reported in these past studies is
not significant between 1986 and 2015 (see Table 2.4).
The all India averaged annual intensity of warmest day
shows a significant increasing trend (about 0.07 °C per
decade) between 1951 and 2015 (Fig. 2.6 and Table 2.5).
The recent 30-year period (1986–2015) shows significant
acceleration for the annual increase in the intensity of
warmest day (about 0.21 °C per decade) and warmest night
(about 0.12 °C per decade), and decrease in the intensity of
Table 2.4 Observed changes in India land mean annual and seasonal frequency indices of daily extreme temperatures for the periods 1951–2015
and 1986–2015
Season
Linear trends 1951–2015 (days per decade)
Linear trends 1986–2015 (days per decade)
Cold nights
(TN10p)
Cold days
(TX10p)
Warm
nights
(TN90p)
Warm days
(TX90p)
Cold nights
(TN10p)
Cold days
(TX10p)
Warm
nights
(TN90p)
Warm days
(TX90p)
Annual
−1.4 ± 2.3
−1.4
*
± 1.1
3.1
*
± 2.2
7.4
*
± 1.7
−6.9
*
± 3.8
−1.2 ± 2.8
7.7
*
± 6.4
9.9
*
± 6.4
Winter (Dec–
Feb)
−0.2 ± 0.5
0.2 ± 0.4
0.6 ± 0.6
2.2
*
± 0.7
−0.5 ± 1.2
0.5 ± 1.4
1.3 ± 1.4
3.3
*
± 2.0
Pre-monsoon
(Mar–May)
−0.2 ± 0.6
−0.4 ± 0.5
0.2 ± 0.7
1.5
*
± 0.6
−2.6
*
± 1.2
−1.0 ± 1.4
1.4 ± 2.2
2.5
*
± 2.4
Monsoon
(Jun–Sep)
−0.3 ± 0.9
−0.6
*
± 0.4
1.7
*
± 0.9
2.4
*
± 0.8
−3.0
*
± 1.5
−0.6 ± 1.1
3.1
*
± 3.0
1.9 ± 3.3
Post-monsoon
(Oct–Nov)
−0.6
*
± 0.4
−0.6
*
± 0.5
0.7
*
± 0.6
1.3
*
± 0.6
−0.8 ± 0.8
−0.1 ± 1.1
1.9 ± 1.9
2.2 ± 2.4
Estimates are derived from the IMD gridded station data. Trends and significance have been calculated as in Table 2.1. Bold values with star sign
(*) indicate that trend is significant (i.e. a trend of zero lies outside the 90% confidence interval)
2 Temperature Changes in India
29
below the 10th (cold) percentile (see more details in
Box 2.2).
Box 2.2 Frequency and Intensity Indices of Daily
Temperature Extremes
The all India averaged annual frequency and intensity
indices of daily extreme temperatures observed over
India during the periods 1951–2015 and 1986–2015
are estimated using the IMD daily maximum and
minimum surface air temperature gridded datasets.
The percentile indices representing the occurrence of
cold nights (TN10p), cold days (TX10p), warm nights
(TN90p) and warm days (TX90p) are defined following Zhang et al. (2011), and describe the threshold
exceedance rate of days where daily minimum or daily
maximum temperature is below the 10th or above the
90th percentile, respectively. The thresholds are based
on the annual cycle of the percentiles calculated for a
5-day sliding window centered on each calendar day in
the base period 1951–1980. The absolute indices
representing the intensity of coldest night (TNn),
coldest day (TXn), warmest night (TNx) and warmest
day (TXx) are also defined following Zhang et al.
(2011), and are presented as annual anomalies from
the 1951–1980 climatological mean.
The significant annual increase of warm days (about
7.4 days per decade) is found to be higher than that of warm
nights (about 3.1 days per decade) during the period 1951–
2015. The magnitude of the significant annual decrease of
cold days (about −1.4 days per decade) is weaker than that
of the annual increase in the frequency of warm extremes for
this long-term period. The seasonal frequency of warm days
and warm nights also increased significantly since 1951,
except for warm nights in the pre-monsoon season
(Table 2.4). The increase in frequency of warm days during
monsoon (about 2.4 days per decade) and winter (about
2.2 days per decade) seasons contribute largely to the
highest annual increase in the number of warm days over
India since 1951. The recent 30-year period (1986–2015)
shows a significant acceleration in the all India averaged
annual increase of warm days (about 9.9 days per decade)
and warm nights (about 7.7 days per decade) and decrease of
cold nights (about −6.9 days per decade). In recent decades,
the significant increase of winter season warm days (about
3.3 days per decade) largely contributes to the accelerated
annual increase in number of warm days over India since
1986. The significant decreases in the frequency of cold
nights during monsoon (about −3.0 days per decade) and
pre-monsoon (about −2.6 days per decade) seasons contribute largely to the accelerated annual decrease in number
of cold nights over India in this recent period (Table 2.4).
The significant increase of pre-monsoon season warm days
(about 2.5 days per decade) assessed for the recent period
1986–2015 is consistent with the earlier assessments of a
gradual increasing trend in all India averaged warm day
frequency during 1970–2005 period (Kothawale et al.
2010b; Revadekar et al. 2012). However, the decreasing
trend in cold day frequency reported in these past studies is
not significant between 1986 and 2015 (see Table 2.4).
The all India averaged annual intensity of warmest day
shows a significant increasing trend (about 0.07 °C per
decade) between 1951 and 2015 (Fig. 2.6 and Table 2.5).
The recent 30-year period (1986–2015) shows significant
acceleration for the annual increase in the intensity of
warmest day (about 0.21 °C per decade) and warmest night
(about 0.12 °C per decade), and decrease in the intensity of
Table 2.4 Observed changes in India land mean annual and seasonal frequency indices of daily extreme temperatures for the periods 1951–2015
and 1986–2015
Season
Linear trends 1951–2015 (days per decade)
Linear trends 1986–2015 (days per decade)
Cold nights
(TN10p)
Cold days
(TX10p)
Warm
nights
(TN90p)
Warm days
(TX90p)
Cold nights
(TN10p)
Cold days
(TX10p)
Warm
nights
(TN90p)
Warm days
(TX90p)
Annual
−1.4 ± 2.3
−1.4
*
± 1.1
3.1
*
± 2.2
7.4
*
± 1.7
−6.9
*
± 3.8
−1.2 ± 2.8
7.7
*
± 6.4
9.9
*
± 6.4
Winter (Dec–
Feb)
−0.2 ± 0.5
0.2 ± 0.4
0.6 ± 0.6
2.2
*
± 0.7
−0.5 ± 1.2
0.5 ± 1.4
1.3 ± 1.4
3.3
*
± 2.0
Pre-monsoon
(Mar–May)
−0.2 ± 0.6
−0.4 ± 0.5
0.2 ± 0.7
1.5
*
± 0.6
−2.6
*
± 1.2
−1.0 ± 1.4
1.4 ± 2.2
2.5
*
± 2.4
Monsoon
(Jun–Sep)
−0.3 ± 0.9
−0.6
*
± 0.4
1.7
*
± 0.9
2.4
*
± 0.8
−3.0
*
± 1.5
−0.6 ± 1.1
3.1
*
± 3.0
1.9 ± 3.3
Post-monsoon
(Oct–Nov)
−0.6
*
± 0.4
−0.6
*
± 0.5
0.7
*
± 0.6
1.3
*
± 0.6
−0.8 ± 0.8
−0.1 ± 1.1
1.9 ± 1.9
2.2 ± 2.4
Estimates are derived from the IMD gridded station data. Trends and significance have been calculated as in Table 2.1. Bold values with star sign
(*) indicate that trend is significant (i.e. a trend of zero lies outside the 90% confidence interval)
2 Temperature Changes in India
29