

Table 11.2 Projected changes
in extreme indices over HKH
represented by the MME median
for near and far future relative to
1976–2005, under the RCP4.5
and RCP8.5 scenarios from
CMIP5 projections
Indices
Near future
Far future
RCP4.5
RCP8.5
RCP4.5
RCP8.5
TXx (°C)
2.2
2.8
2.7
4.8
TNn (°C)
2.3
3.3
3.0
5.1
R95p (%)
22
32
33
62
RX5day (%)
8
12
13
24
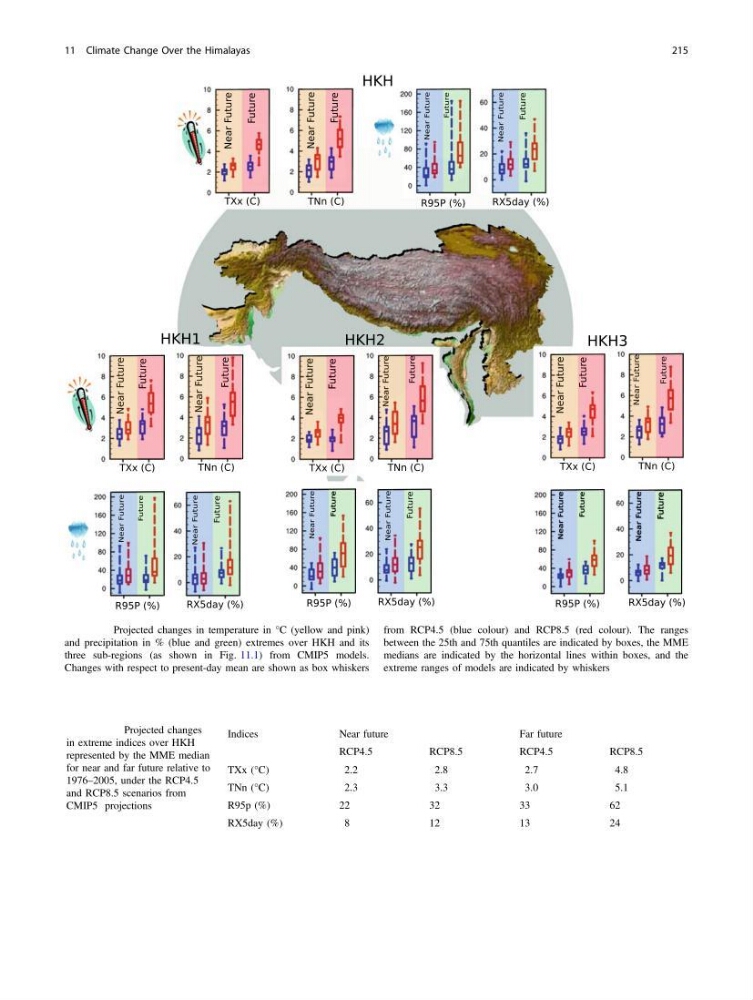
Fig. 11.6 Projected changes in temperature in °C (yellow and pink)
and precipitation in % (blue and green) extremes over HKH and its
three sub-regions (as shown in Fig. 11.1) from CMIP5 models.
Changes with respect to present-day mean are shown as box whiskers
from RCP4.5 (blue colour) and RCP8.5 (red colour). The ranges
between the 25th and 75th quantiles are indicated by boxes, the MME
medians are indicated by the horizontal lines within boxes, and the
extreme ranges of models are indicated by whiskers
11 Climate Change Over the Himalayas
215
in extreme indices over HKH
represented by the MME median
for near and far future relative to
1976–2005, under the RCP4.5
and RCP8.5 scenarios from
CMIP5 projections
Indices
Near future
Far future
RCP4.5
RCP8.5
RCP4.5
RCP8.5
TXx (°C)
2.2
2.8
2.7
4.8
TNn (°C)
2.3
3.3
3.0
5.1
R95p (%)
22
32
33
62
RX5day (%)
8
12
13
24
Fig. 11.6 Projected changes in temperature in °C (yellow and pink)
and precipitation in % (blue and green) extremes over HKH and its
three sub-regions (as shown in Fig. 11.1) from CMIP5 models.
Changes with respect to present-day mean are shown as box whiskers
from RCP4.5 (blue colour) and RCP8.5 (red colour). The ranges
between the 25th and 75th quantiles are indicated by boxes, the MME
medians are indicated by the horizontal lines within boxes, and the
extreme ranges of models are indicated by whiskers
11 Climate Change Over the Himalayas
215