

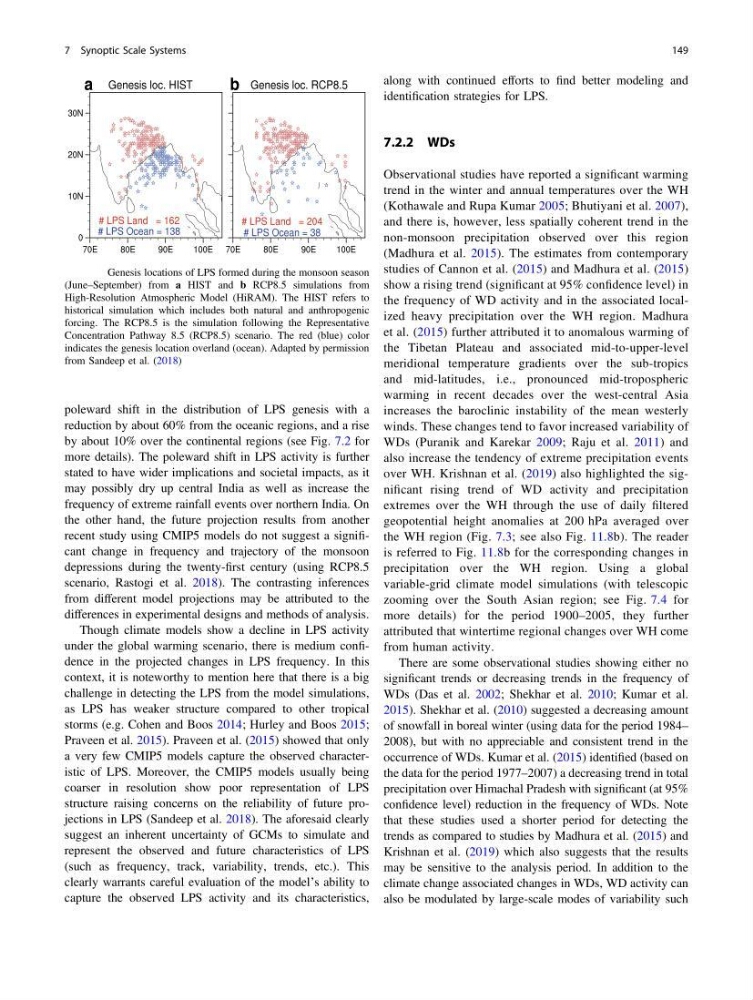
poleward shift in the distribution of LPS genesis with a
reduction by about 60% from the oceanic regions, and a rise
by about 10% over the continental regions (see Fig. 7.2 for
more details). The poleward shift in LPS activity is further
stated to have wider implications and societal impacts, as it
may possibly dry up central India as well as increase the
frequency of extreme rainfall events over northern India. On
the other hand, the future projection results from another
recent study using CMIP5 models do not suggest a significant change in frequency and trajectory of the monsoon
depressions during the twenty-first century (using RCP8.5
scenario, Rastogi et al. 2018). The contrasting inferences
from different model projections may be attributed to the
differences in experimental designs and methods of analysis.
Though climate models show a decline in LPS activity
under the global warming scenario, there is medium confidence in the projected changes in LPS frequency. In this
context, it is noteworthy to mention here that there is a big
challenge in detecting the LPS from the model simulations,
as LPS has weaker structure compared to other tropical
storms (e.g. Cohen and Boos 2014; Hurley and Boos 2015;
Praveen et al. 2015). Praveen et al. (2015) showed that only
a very few CMIP5 models capture the observed characteristic of LPS. Moreover, the CMIP5 models usually being
coarser in resolution show poor representation of LPS
structure raising concerns on the reliability of future projections in LPS (Sandeep et al. 2018). The aforesaid clearly
suggest an inherent uncertainty of GCMs to simulate and
represent the observed and future characteristics of LPS
(such as frequency, track, variability, trends, etc.). This
clearly warrants careful evaluation of the model’s ability to
capture the observed LPS activity and its characteristics,
along with continued efforts to find better modeling and
identification strategies for LPS.
7.2.2 WDs
Observational studies have reported a significant warming
trend in the winter and annual temperatures over the WH
(Kothawale and Rupa Kumar 2005; Bhutiyani et al. 2007),
and there is, however, less spatially coherent trend in the
non-monsoon precipitation observed over this region
(Madhura et al. 2015). The estimates from contemporary
studies of Cannon et al. (2015) and Madhura et al. (2015)
show a rising trend (significant at 95% confidence level) in
the frequency of WD activity and in the associated localized heavy precipitation over the WH region. Madhura
et al. (2015) further attributed it to anomalous warming of
the Tibetan Plateau and associated mid-to-upper-level
meridional temperature gradients over the sub-tropics
and mid-latitudes, i.e., pronounced mid-tropospheric
warming in recent decades over the west-central Asia
increases the baroclinic instability of the mean westerly
winds. These changes tend to favor increased variability of
WDs (Puranik and Karekar 2009; Raju et al. 2011) and
also increase the tendency of extreme precipitation events
over WH. Krishnan et al. (2019) also highlighted the significant rising trend of WD activity and precipitation
extremes over the WH through the use of daily filtered
geopotential height anomalies at 200 hPa averaged over
the WH region (Fig. 7.3; see also Fig. 11.8b). The reader
is referred to Fig. 11.8b for the corresponding changes in
precipitation over the WH region. Using a global
variable-grid climate model simulations (with telescopic
zooming over the South Asian region; see Fig. 7.4 for
more details) for the period 1900–2005, they further
attributed that wintertime regional changes over WH come
from human activity.
There are some observational studies showing either no
significant trends or decreasing trends in the frequency of
WDs (Das et al. 2002; Shekhar et al. 2010; Kumar et al.
2015). Shekhar et al. (2010) suggested a decreasing amount
of snowfall in boreal winter (using data for the period 1984–
2008), but with no appreciable and consistent trend in the
occurrence of WDs. Kumar et al. (2015) identified (based on
the data for the period 1977–2007) a decreasing trend in total
precipitation over Himachal Pradesh with significant (at 95%
confidence level) reduction in the frequency of WDs. Note
that these studies used a shorter period for detecting the
trends as compared to studies by Madhura et al. (2015) and
Krishnan et al. (2019) which also suggests that the results
may be sensitive to the analysis period. In addition to the
climate change associated changes in WDs, WD activity can
also be modulated by large-scale modes of variability such
b
a
Fig. 7.2 Genesis locations of LPS formed during the monsoon season
(June–September) from a HIST and b RCP8.5 simulations from
High-Resolution Atmospheric Model (HiRAM). The HIST refers to
historical simulation which includes both natural and anthropogenic
forcing. The RCP8.5 is the simulation following the Representative
Concentration Pathway 8.5 (RCP8.5) scenario. The red (blue) color
indicates the genesis location overland (ocean). Adapted by permission
from Sandeep et al. (2018)
7 Synoptic Scale Systems
149
reduction by about 60% from the oceanic regions, and a rise
by about 10% over the continental regions (see Fig. 7.2 for
more details). The poleward shift in LPS activity is further
stated to have wider implications and societal impacts, as it
may possibly dry up central India as well as increase the
frequency of extreme rainfall events over northern India. On
the other hand, the future projection results from another
recent study using CMIP5 models do not suggest a significant change in frequency and trajectory of the monsoon
depressions during the twenty-first century (using RCP8.5
scenario, Rastogi et al. 2018). The contrasting inferences
from different model projections may be attributed to the
differences in experimental designs and methods of analysis.
Though climate models show a decline in LPS activity
under the global warming scenario, there is medium confidence in the projected changes in LPS frequency. In this
context, it is noteworthy to mention here that there is a big
challenge in detecting the LPS from the model simulations,
as LPS has weaker structure compared to other tropical
storms (e.g. Cohen and Boos 2014; Hurley and Boos 2015;
Praveen et al. 2015). Praveen et al. (2015) showed that only
a very few CMIP5 models capture the observed characteristic of LPS. Moreover, the CMIP5 models usually being
coarser in resolution show poor representation of LPS
structure raising concerns on the reliability of future projections in LPS (Sandeep et al. 2018). The aforesaid clearly
suggest an inherent uncertainty of GCMs to simulate and
represent the observed and future characteristics of LPS
(such as frequency, track, variability, trends, etc.). This
clearly warrants careful evaluation of the model’s ability to
capture the observed LPS activity and its characteristics,
along with continued efforts to find better modeling and
identification strategies for LPS.
7.2.2 WDs
Observational studies have reported a significant warming
trend in the winter and annual temperatures over the WH
(Kothawale and Rupa Kumar 2005; Bhutiyani et al. 2007),
and there is, however, less spatially coherent trend in the
non-monsoon precipitation observed over this region
(Madhura et al. 2015). The estimates from contemporary
studies of Cannon et al. (2015) and Madhura et al. (2015)
show a rising trend (significant at 95% confidence level) in
the frequency of WD activity and in the associated localized heavy precipitation over the WH region. Madhura
et al. (2015) further attributed it to anomalous warming of
the Tibetan Plateau and associated mid-to-upper-level
meridional temperature gradients over the sub-tropics
and mid-latitudes, i.e., pronounced mid-tropospheric
warming in recent decades over the west-central Asia
increases the baroclinic instability of the mean westerly
winds. These changes tend to favor increased variability of
WDs (Puranik and Karekar 2009; Raju et al. 2011) and
also increase the tendency of extreme precipitation events
over WH. Krishnan et al. (2019) also highlighted the significant rising trend of WD activity and precipitation
extremes over the WH through the use of daily filtered
geopotential height anomalies at 200 hPa averaged over
the WH region (Fig. 7.3; see also Fig. 11.8b). The reader
is referred to Fig. 11.8b for the corresponding changes in
precipitation over the WH region. Using a global
variable-grid climate model simulations (with telescopic
zooming over the South Asian region; see Fig. 7.4 for
more details) for the period 1900–2005, they further
attributed that wintertime regional changes over WH come
from human activity.
There are some observational studies showing either no
significant trends or decreasing trends in the frequency of
WDs (Das et al. 2002; Shekhar et al. 2010; Kumar et al.
2015). Shekhar et al. (2010) suggested a decreasing amount
of snowfall in boreal winter (using data for the period 1984–
2008), but with no appreciable and consistent trend in the
occurrence of WDs. Kumar et al. (2015) identified (based on
the data for the period 1977–2007) a decreasing trend in total
precipitation over Himachal Pradesh with significant (at 95%
confidence level) reduction in the frequency of WDs. Note
that these studies used a shorter period for detecting the
trends as compared to studies by Madhura et al. (2015) and
Krishnan et al. (2019) which also suggests that the results
may be sensitive to the analysis period. In addition to the
climate change associated changes in WDs, WD activity can
also be modulated by large-scale modes of variability such
b
a
Fig. 7.2 Genesis locations of LPS formed during the monsoon season
(June–September) from a HIST and b RCP8.5 simulations from
High-Resolution Atmospheric Model (HiRAM). The HIST refers to
historical simulation which includes both natural and anthropogenic
forcing. The RCP8.5 is the simulation following the Representative
Concentration Pathway 8.5 (RCP8.5) scenario. The red (blue) color
indicates the genesis location overland (ocean). Adapted by permission
from Sandeep et al. (2018)
7 Synoptic Scale Systems
149