

cold and dry air mass of extra-tropical character (Mooley
1957). So the interaction between the tropics and
mid-latitude systems is manifested in WDs with associated
extensive cloudiness in the mid and high levels (Kalsi 1980;
Kalsi and Halder 1992; Dimri 2007).
In association with WD passages, the Karakoram, Hindu
Kush Mountain Ranges and also the northern part of India
oftentimes experience extreme winter precipitation and
flooding conditions, and the snowfall from WDs is the major
precipitation input for the Himalayan Rivers (Pisharoty and
Desai 1956; Mooley 1957; Rangachary and Bandyopadhyay
1987; Lang and Barros 2004; Hunt et al. 2018c; Roy and
Roy Bhowmik 2005; Kotal et al. 2014; Dimri et al. 2015).
The wintertime precipitation from the WDs, a
non-monsoonal type of precipitation (Krishnan et al. 2019),
contributes significantly by about 30% to the annual mean
precipitation over the north Indian region (e.g. Dimri 2013a,
Dimri 2013b).
On an average, 4–6 intense WDs are observed during the
DJFMA (Pisharoty and Desai 1956; Rao and Srinivasan
1969; Chattopadhyay 1970; Dhar et al. 1984; Rangachary
and Bandyopadhyay 1987; Mohanty et al. 1998; Hatwar
et al. 2005; Dimri et al. 2015; Cannon et al. 2016; Hunt et al.
2018b). The life cycle of WDs typically ranges between 2
and 4 days, and WDs are relatively rapidly moving weather
systems with zonal speeds of about 8–10° longitude/day
(about 10–12 m s
−1 ) (Datta and Gupta 1967; Rao and
Srinivasan 1969). The periodicity of WDs ranges from 4 to
12 days as noted by various studies (Krishnan et al. 2019;
Rao and Rao 1971; Chattopadhyay 1970).
7.2 Observed Variability and Future
Projections
7.2.1 Monsoon LPS
LPS plays a significant role in the Indian summer monsoon
seasonal total rainfall. Hence, it is of paramount importance
to understand their statistics on frequency, duration, etc.
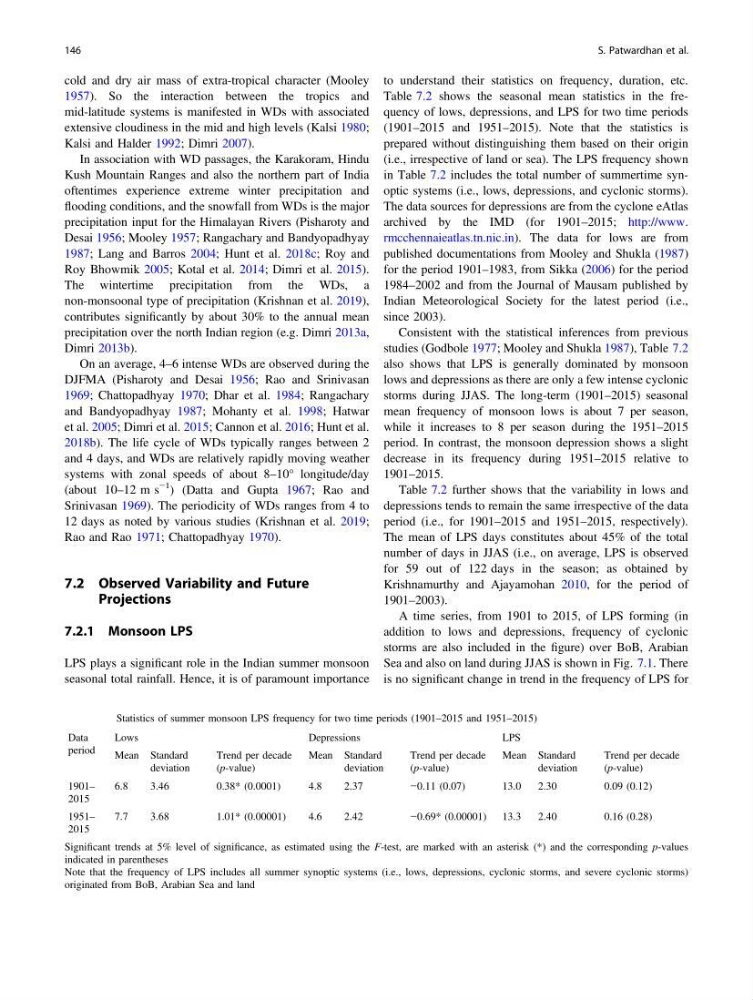
Table 7.2 shows the seasonal mean statistics in the frequency of lows, depressions, and LPS for two time periods
(1901–2015 and 1951–2015). Note that the statistics is
prepared without distinguishing them based on their origin
(i.e., irrespective of land or sea). The LPS frequency shown
in Table 7.2 includes the total number of summertime synoptic systems (i.e., lows, depressions, and cyclonic storms).
The data sources for depressions are from the cyclone eAtlas
archived by the IMD (for 1901–2015; http://www.
rmcchennaieatlas.tn.nic.in). The data for lows are from
published documentations from Mooley and Shukla (1987)
for the period 1901–1983, from Sikka (2006) for the period
1984–2002 and from the Journal of Mausam published by
Indian Meteorological Society for the latest period (i.e.,
since 2003).
Consistent with the statistical inferences from previous
studies (Godbole 1977; Mooley and Shukla 1987), Table 7.2
also shows that LPS is generally dominated by monsoon
lows and depressions as there are only a few intense cyclonic
storms during JJAS. The long-term (1901–2015) seasonal
mean frequency of monsoon lows is about 7 per season,
while it increases to 8 per season during the 1951–2015
period. In contrast, the monsoon depression shows a slight
decrease in its frequency during 1951–2015 relative to
1901–2015.
Table 7.2 further shows that the variability in lows and
depressions tends to remain the same irrespective of the data
period (i.e., for 1901–2015 and 1951–2015, respectively).
The mean of LPS days constitutes about 45% of the total
number of days in JJAS (i.e., on average, LPS is observed
for 59 out of 122 days in the season; as obtained by
Krishnamurthy and Ajayamohan 2010, for the period of
1901–2003).
A time series, from 1901 to 2015, of LPS forming (in
addition to lows and depressions, frequency of cyclonic
storms are also included in the figure) over BoB, Arabian
Sea and also on land during JJAS is shown in Fig. 7.1. There
is no significant change in trend in the frequency of LPS for
Table 7.2 Statistics of summer monsoon LPS frequency for two time periods (1901–2015 and 1951–2015)
Data
period
Lows
Depressions
LPS
Mean Standard
deviation
Trend per decade
(p-value)
Mean Standard
deviation
Trend per decade
(p-value)
Mean Standard
deviation
Trend per decade
(p-value)
1901–
2015
6.8
3.46
0.38* (0.0001)
4.8
2.37
−0.11 (0.07)
13.0
2.30
0.09 (0.12)
1951–
2015
7.7
3.68
1.01* (0.00001)
4.6
2.42
−0.69* (0.00001) 13.3
2.40
0.16 (0.28)
Significant trends at 5% level of significance, as estimated using the F-test, are marked with an asterisk (*) and the corresponding p-values
indicated in parentheses
Note that the frequency of LPS includes all summer synoptic systems (i.e., lows, depressions, cyclonic storms, and severe cyclonic storms)
originated from BoB, Arabian Sea and land
146
S. Patwardhan et al.
1957). So the interaction between the tropics and
mid-latitude systems is manifested in WDs with associated
extensive cloudiness in the mid and high levels (Kalsi 1980;
Kalsi and Halder 1992; Dimri 2007).
In association with WD passages, the Karakoram, Hindu
Kush Mountain Ranges and also the northern part of India
oftentimes experience extreme winter precipitation and
flooding conditions, and the snowfall from WDs is the major
precipitation input for the Himalayan Rivers (Pisharoty and
Desai 1956; Mooley 1957; Rangachary and Bandyopadhyay
1987; Lang and Barros 2004; Hunt et al. 2018c; Roy and
Roy Bhowmik 2005; Kotal et al. 2014; Dimri et al. 2015).
The wintertime precipitation from the WDs, a
non-monsoonal type of precipitation (Krishnan et al. 2019),
contributes significantly by about 30% to the annual mean
precipitation over the north Indian region (e.g. Dimri 2013a,
Dimri 2013b).
On an average, 4–6 intense WDs are observed during the
DJFMA (Pisharoty and Desai 1956; Rao and Srinivasan
1969; Chattopadhyay 1970; Dhar et al. 1984; Rangachary
and Bandyopadhyay 1987; Mohanty et al. 1998; Hatwar
et al. 2005; Dimri et al. 2015; Cannon et al. 2016; Hunt et al.
2018b). The life cycle of WDs typically ranges between 2
and 4 days, and WDs are relatively rapidly moving weather
systems with zonal speeds of about 8–10° longitude/day
(about 10–12 m s
−1 ) (Datta and Gupta 1967; Rao and
Srinivasan 1969). The periodicity of WDs ranges from 4 to
12 days as noted by various studies (Krishnan et al. 2019;
Rao and Rao 1971; Chattopadhyay 1970).
7.2 Observed Variability and Future
Projections
7.2.1 Monsoon LPS
LPS plays a significant role in the Indian summer monsoon
seasonal total rainfall. Hence, it is of paramount importance
to understand their statistics on frequency, duration, etc.
Table 7.2 shows the seasonal mean statistics in the frequency of lows, depressions, and LPS for two time periods
(1901–2015 and 1951–2015). Note that the statistics is
prepared without distinguishing them based on their origin
(i.e., irrespective of land or sea). The LPS frequency shown
in Table 7.2 includes the total number of summertime synoptic systems (i.e., lows, depressions, and cyclonic storms).
The data sources for depressions are from the cyclone eAtlas
archived by the IMD (for 1901–2015; http://www.
rmcchennaieatlas.tn.nic.in). The data for lows are from
published documentations from Mooley and Shukla (1987)
for the period 1901–1983, from Sikka (2006) for the period
1984–2002 and from the Journal of Mausam published by
Indian Meteorological Society for the latest period (i.e.,
since 2003).
Consistent with the statistical inferences from previous
studies (Godbole 1977; Mooley and Shukla 1987), Table 7.2
also shows that LPS is generally dominated by monsoon
lows and depressions as there are only a few intense cyclonic
storms during JJAS. The long-term (1901–2015) seasonal
mean frequency of monsoon lows is about 7 per season,
while it increases to 8 per season during the 1951–2015
period. In contrast, the monsoon depression shows a slight
decrease in its frequency during 1951–2015 relative to
1901–2015.
Table 7.2 further shows that the variability in lows and
depressions tends to remain the same irrespective of the data
period (i.e., for 1901–2015 and 1951–2015, respectively).
The mean of LPS days constitutes about 45% of the total
number of days in JJAS (i.e., on average, LPS is observed
for 59 out of 122 days in the season; as obtained by
Krishnamurthy and Ajayamohan 2010, for the period of
1901–2003).
A time series, from 1901 to 2015, of LPS forming (in
addition to lows and depressions, frequency of cyclonic
storms are also included in the figure) over BoB, Arabian
Sea and also on land during JJAS is shown in Fig. 7.1. There
is no significant change in trend in the frequency of LPS for
Table 7.2 Statistics of summer monsoon LPS frequency for two time periods (1901–2015 and 1951–2015)
Data
period
Lows
Depressions
LPS
Mean Standard
deviation
Trend per decade
(p-value)
Mean Standard
deviation
Trend per decade
(p-value)
Mean Standard
deviation
Trend per decade
(p-value)
1901–
2015
6.8
3.46
0.38* (0.0001)
4.8
2.37
−0.11 (0.07)
13.0
2.30
0.09 (0.12)
1951–
2015
7.7
3.68
1.01* (0.00001)
4.6
2.42
−0.69* (0.00001) 13.3
2.40
0.16 (0.28)
Significant trends at 5% level of significance, as estimated using the F-test, are marked with an asterisk (*) and the corresponding p-values
indicated in parentheses
Note that the frequency of LPS includes all summer synoptic systems (i.e., lows, depressions, cyclonic storms, and severe cyclonic storms)
originated from BoB, Arabian Sea and land
146
S. Patwardhan et al.