

5.3.4 Variations in Ozone and NO x Due
to Lightning
The composition of trace gases in the troposphere is influenced by lightning in addition to anthropogenic emissions. It
is estimated that lightning contributes to about 10% of the
global annual NO source (Schumann and Huntrieser 2007).
It can contribute up to 90% variation of NO x at the altitudes
of 5–15 km. Variation of ozone in the middle/upper troposphere due to lightning may change ozone heating rates and
may have an impact on Asian monsoon circulation (Roy
et al. 2017).
Over the Asian region, lightning contributes *40% to
NO x and 20% to ozone production in the middle and upper
troposphere during the monsoon season (Fadnavis et al.
2014a). Previous studies (Bharali et al. 2015) have reported
an increase in the O 3 mixing ratio *18 ppbv during
pre-monsoon and *12 ppbv during summer associated with
the lightning activity over Dibrugarh (27.4° N, 94.9° E) in
northern India and over Hyderabad (17.44° N, 78.30° E) (a
station in southern peninsular India) (Venkanna et al. 2016).
Kavitha et al. (2018) reported an enhancement in NO x (5.2–
8.7 ppbv) and an associated reduction in surface O 3 mixing
ratio (9.9–18.8 ppbv) during pre-monsoon and monsoon
seasons due to lightning activity.
5.3.5 Radiative Forcing due to Ozone
and Precursor Gases
The radiative forcing (RF) due to changes in tropospheric
and stratospheric ozone is the third-largest GHGs contributor
to RF since pre-industrial times. According to the (IPCC
2013), the total increase in global radiative forcing due to
changes in ozone is +0.35 (0.15–0.55) W m
−2 (high confidence), with radiative forcing due to tropospheric ozone
+0.40 (0.20–0.60) W m
−2 (high confidence) and due to
stratospheric ozone −0.05 (−0.15 to +0.05) W m
−2 (high
confidence). ACCMIP tropospheric ozone future projections
(2100–1850) show global mean annual average anthropogenic forcing *0.14 ± 0.12 W m
−2 in RCP 2.6,
0.23 ± 0.15 W m
−2 in RCP 4.5, 0.25 ± 0.09 W m
−2 in
RCP 6.0, and 0.55 ± 0.30 W m
−2 in RCP 8.5.
According to the CMIP5 estimates, the tropospheric
ozone radiative forcing from the 1850s to the 2000s is
+0.23 W m
−2 , lower than the IPCC estimate (IPCC 2013).
The lower value is mainly due to (i) a smaller increase in
biomass burning emissions; (ii) a larger influence of stratospheric ozone depletion on upper tropospheric ozone at high
southern latitudes; and possibly (iii) a larger influence of
clouds (which act to reduce the net forcing). Over the same
period, decreases in stratospheric ozone, mainly at high
latitudes, produce an RF of −0.08 W m
−2 , which is more
negative than the IPCC but is within the stated range of
−0.15 to +0.05 W m
−2 (Cionni et al. 2011; Eyring et al.
2013).
Estimates over India suggest that the radiative forcing has
changed in the range between 0.2 and 0.4 W m
−2 since
pre-industrial times (Chalita et al. 1996). The radiative
forcing effect from tropospheric ozone is regional due to its
short lifetime. The model simulations with 10% reductions
in the precursor’s emission over India resulted in a decrease
of *0.59 m W m
−2 (Naik et al. 2005).
For the other trace gases mentioned in this chapter, the
resultant effect on radiative forcing is not direct. Gases such
as CO, NO x , and VOCs are precursors of ozone and hence
have an indirect impact on radiative forcing. Additionally,
gases such as sulfur dioxide (SO 2 ) and NO x also contribute
to the formation of sulfate and nitrate aerosols, which can
have a net cooling effect on the atmosphere. Globally, the
contribution from CO and NMVOCs toward ozone radiative
forcing is estimated to be about +0.2 (−0.18 to +0.9) W m
−2
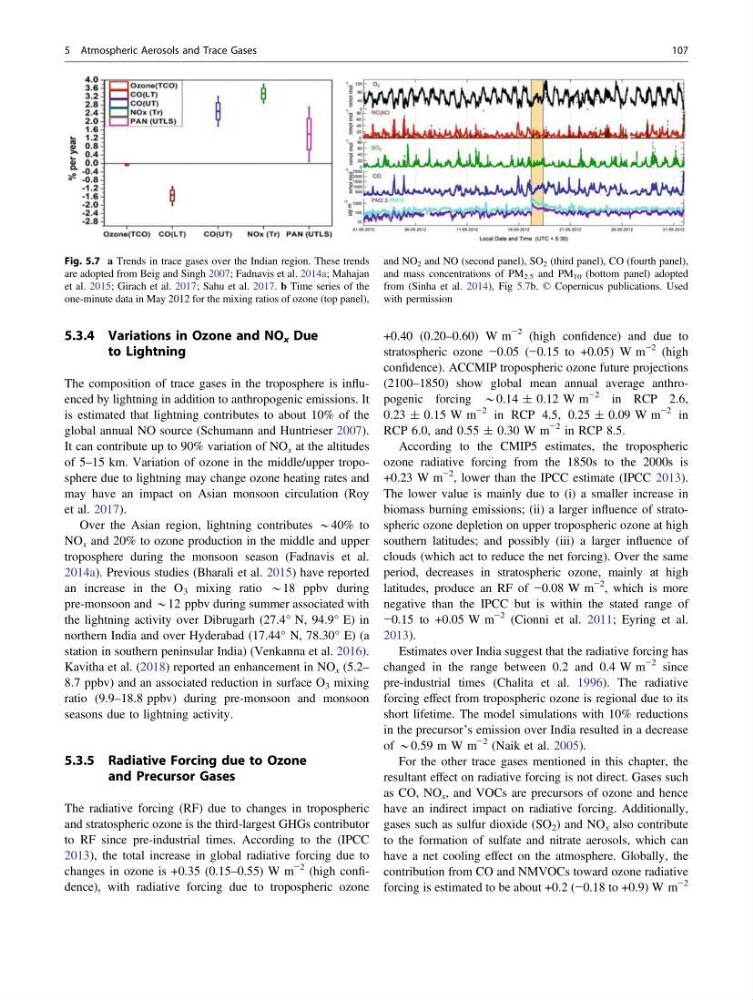
Fig. 5.7 a Trends in trace gases over the Indian region. These trends
are adopted from Beig and Singh 2007; Fadnavis et al. 2014a; Mahajan
et al. 2015; Girach et al. 2017; Sahu et al. 2017. b Time series of the
one-minute data in May 2012 for the mixing ratios of ozone (top panel),
and NO 2 and NO (second panel), SO 2 (third panel), CO (fourth panel),
and mass concentrations of PM 2.5 and PM 10 (bottom panel) adopted
from (Sinha et al. 2014), Fig 5.7b. © Copernicus publications. Used
with permission
5 Atmospheric Aerosols and Trace Gases
107
to Lightning
The composition of trace gases in the troposphere is influenced by lightning in addition to anthropogenic emissions. It
is estimated that lightning contributes to about 10% of the
global annual NO source (Schumann and Huntrieser 2007).
It can contribute up to 90% variation of NO x at the altitudes
of 5–15 km. Variation of ozone in the middle/upper troposphere due to lightning may change ozone heating rates and
may have an impact on Asian monsoon circulation (Roy
et al. 2017).
Over the Asian region, lightning contributes *40% to
NO x and 20% to ozone production in the middle and upper
troposphere during the monsoon season (Fadnavis et al.
2014a). Previous studies (Bharali et al. 2015) have reported
an increase in the O 3 mixing ratio *18 ppbv during
pre-monsoon and *12 ppbv during summer associated with
the lightning activity over Dibrugarh (27.4° N, 94.9° E) in
northern India and over Hyderabad (17.44° N, 78.30° E) (a
station in southern peninsular India) (Venkanna et al. 2016).
Kavitha et al. (2018) reported an enhancement in NO x (5.2–
8.7 ppbv) and an associated reduction in surface O 3 mixing
ratio (9.9–18.8 ppbv) during pre-monsoon and monsoon
seasons due to lightning activity.
5.3.5 Radiative Forcing due to Ozone
and Precursor Gases
The radiative forcing (RF) due to changes in tropospheric
and stratospheric ozone is the third-largest GHGs contributor
to RF since pre-industrial times. According to the (IPCC
2013), the total increase in global radiative forcing due to
changes in ozone is +0.35 (0.15–0.55) W m
−2 (high confidence), with radiative forcing due to tropospheric ozone
+0.40 (0.20–0.60) W m
−2 (high confidence) and due to
stratospheric ozone −0.05 (−0.15 to +0.05) W m
−2 (high
confidence). ACCMIP tropospheric ozone future projections
(2100–1850) show global mean annual average anthropogenic forcing *0.14 ± 0.12 W m
−2 in RCP 2.6,
0.23 ± 0.15 W m
−2 in RCP 4.5, 0.25 ± 0.09 W m
−2 in
RCP 6.0, and 0.55 ± 0.30 W m
−2 in RCP 8.5.
According to the CMIP5 estimates, the tropospheric
ozone radiative forcing from the 1850s to the 2000s is
+0.23 W m
−2 , lower than the IPCC estimate (IPCC 2013).
The lower value is mainly due to (i) a smaller increase in
biomass burning emissions; (ii) a larger influence of stratospheric ozone depletion on upper tropospheric ozone at high
southern latitudes; and possibly (iii) a larger influence of
clouds (which act to reduce the net forcing). Over the same
period, decreases in stratospheric ozone, mainly at high
latitudes, produce an RF of −0.08 W m
−2 , which is more
negative than the IPCC but is within the stated range of
−0.15 to +0.05 W m
−2 (Cionni et al. 2011; Eyring et al.
2013).
Estimates over India suggest that the radiative forcing has
changed in the range between 0.2 and 0.4 W m
−2 since
pre-industrial times (Chalita et al. 1996). The radiative
forcing effect from tropospheric ozone is regional due to its
short lifetime. The model simulations with 10% reductions
in the precursor’s emission over India resulted in a decrease
of *0.59 m W m
−2 (Naik et al. 2005).
For the other trace gases mentioned in this chapter, the
resultant effect on radiative forcing is not direct. Gases such
as CO, NO x , and VOCs are precursors of ozone and hence
have an indirect impact on radiative forcing. Additionally,
gases such as sulfur dioxide (SO 2 ) and NO x also contribute
to the formation of sulfate and nitrate aerosols, which can
have a net cooling effect on the atmosphere. Globally, the
contribution from CO and NMVOCs toward ozone radiative
forcing is estimated to be about +0.2 (−0.18 to +0.9) W m
−2
Fig. 5.7 a Trends in trace gases over the Indian region. These trends
are adopted from Beig and Singh 2007; Fadnavis et al. 2014a; Mahajan
et al. 2015; Girach et al. 2017; Sahu et al. 2017. b Time series of the
one-minute data in May 2012 for the mixing ratios of ozone (top panel),
and NO 2 and NO (second panel), SO 2 (third panel), CO (fourth panel),
and mass concentrations of PM 2.5 and PM 10 (bottom panel) adopted
from (Sinha et al. 2014), Fig 5.7b. © Copernicus publications. Used
with permission
5 Atmospheric Aerosols and Trace Gases
107