

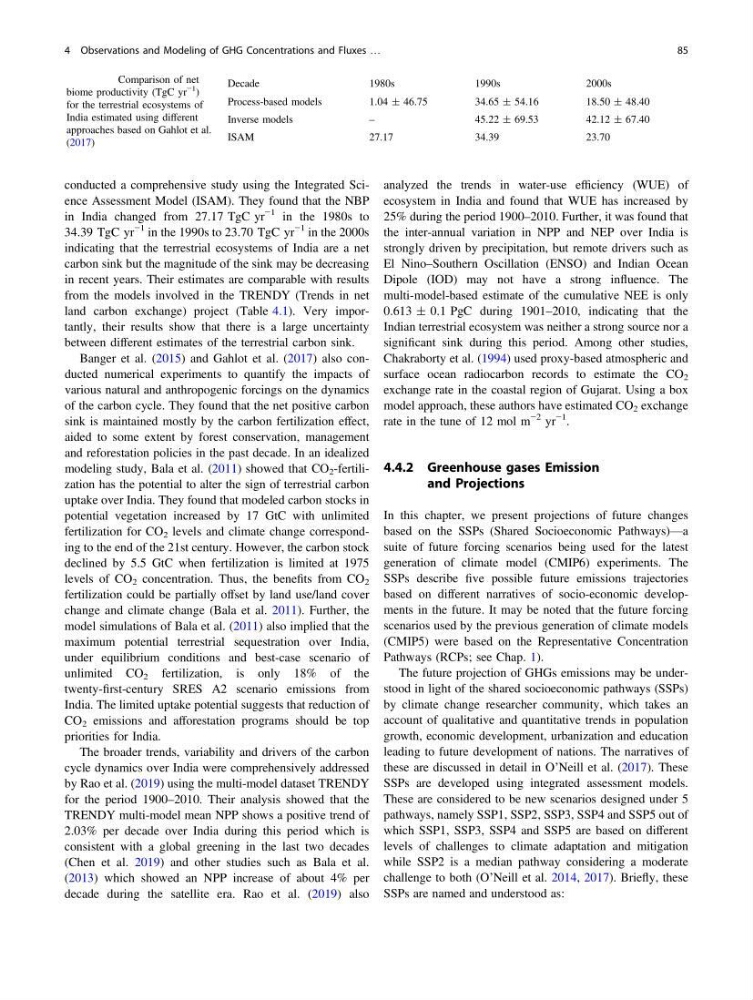
conducted a comprehensive study using the Integrated Science Assessment Model (ISAM). They found that the NBP
in India changed from 27.17 TgC yr
−1 in the 1980s to
34.39 TgC yr
−1 in the 1990s to 23.70 TgC yr
−1 in the 2000s
indicating that the terrestrial ecosystems of India are a net
carbon sink but the magnitude of the sink may be decreasing
in recent years. Their estimates are comparable with results
from the models involved in the TRENDY (Trends in net
land carbon exchange) project (Table 4.1). Very importantly, their results show that there is a large uncertainty
between different estimates of the terrestrial carbon sink.
Banger et al. (2015) and Gahlot et al. (2017) also conducted numerical experiments to quantify the impacts of
various natural and anthropogenic forcings on the dynamics
of the carbon cycle. They found that the net positive carbon
sink is maintained mostly by the carbon fertilization effect,
aided to some extent by forest conservation, management
and reforestation policies in the past decade. In an idealized
modeling study, Bala et al. (2011) showed that CO 2 -fertilization has the potential to alter the sign of terrestrial carbon
uptake over India. They found that modeled carbon stocks in
potential vegetation increased by 17 GtC with unlimited
fertilization for CO 2 levels and climate change corresponding to the end of the 21st century. However, the carbon stock
declined by 5.5 GtC when fertilization is limited at 1975
levels of CO 2 concentration. Thus, the benefits from CO 2
fertilization could be partially offset by land use/land cover
change and climate change (Bala et al. 2011). Further, the
model simulations of Bala et al. (2011) also implied that the
maximum potential terrestrial sequestration over India,
under equilibrium conditions and best-case scenario of
unlimited CO 2 fertilization, is only 18% of the
twenty-first-century SRES A2 scenario emissions from
India. The limited uptake potential suggests that reduction of
CO 2 emissions and afforestation programs should be top
priorities for India.
The broader trends, variability and drivers of the carbon
cycle dynamics over India were comprehensively addressed
by Rao et al. (2019) using the multi-model dataset TRENDY
for the period 1900–2010. Their analysis showed that the
TRENDY multi-model mean NPP shows a positive trend of
2.03% per decade over India during this period which is
consistent with a global greening in the last two decades
(Chen et al. 2019) and other studies such as Bala et al.
(2013) which showed an NPP increase of about 4% per
decade during the satellite era. Rao et al. (2019) also
analyzed the trends in water-use efficiency (WUE) of
ecosystem in India and found that WUE has increased by
25% during the period 1900–2010. Further, it was found that
the inter-annual variation in NPP and NEP over India is
strongly driven by precipitation, but remote drivers such as
El Nino–Southern Oscillation (ENSO) and Indian Ocean
Dipole (IOD) may not have a strong influence. The
multi-model-based estimate of the cumulative NEE is only
0.613 ± 0.1 PgC during 1901–2010, indicating that the
Indian terrestrial ecosystem was neither a strong source nor a
significant sink during this period. Among other studies,
Chakraborty et al. (1994) used proxy-based atmospheric and
surface ocean radiocarbon records to estimate the CO 2
exchange rate in the coastal region of Gujarat. Using a box
model approach, these authors have estimated CO 2 exchange
rate in the tune of 12 mol m
−2 yr
−1 .
4.4.2 Greenhouse gases Emission
and Projections
In this chapter, we present projections of future changes
based on the SSPs (Shared Socioeconomic Pathways)—a
suite of future forcing scenarios being used for the latest
generation of climate model (CMIP6) experiments. The
SSPs describe five possible future emissions trajectories
based on different narratives of socio-economic developments in the future. It may be noted that the future forcing
scenarios used by the previous generation of climate models
(CMIP5) were based on the Representative Concentration
Pathways (RCPs; see Chap. 1).
The future projection of GHGs emissions may be understood in light of the shared socioeconomic pathways (SSPs)
by climate change researcher community, which takes an
account of qualitative and quantitative trends in population
growth, economic development, urbanization and education
leading to future development of nations. The narratives of
these are discussed in detail in O’Neill et al. (2017). These
SSPs are developed using integrated assessment models.
These are considered to be new scenarios designed under 5
pathways, namely SSP1, SSP2, SSP3, SSP4 and SSP5 out of
which SSP1, SSP3, SSP4 and SSP5 are based on different
levels of challenges to climate adaptation and mitigation
while SSP2 is a median pathway considering a moderate
challenge to both (O’Neill et al. 2014, 2017). Briefly, these
SSPs are named and understood as:
Table 4.1 Comparison of net
biome productivity (TgC yr
−1
)
for the terrestrial ecosystems of
India estimated using different
approaches based on Gahlot et al.
(2017)
Decade
1980s
1990s
2000s
Process-based models
1.04 ± 46.75
34.65 ± 54.16
18.50 ± 48.40
Inverse models
–
45.22 ± 69.53
42.12 ± 67.40
ISAM
27.17
34.39
23.70
4 Observations and Modeling of GHG Concentrations and Fluxes …
85
in India changed from 27.17 TgC yr
−1 in the 1980s to
34.39 TgC yr
−1 in the 1990s to 23.70 TgC yr
−1 in the 2000s
indicating that the terrestrial ecosystems of India are a net
carbon sink but the magnitude of the sink may be decreasing
in recent years. Their estimates are comparable with results
from the models involved in the TRENDY (Trends in net
land carbon exchange) project (Table 4.1). Very importantly, their results show that there is a large uncertainty
between different estimates of the terrestrial carbon sink.
Banger et al. (2015) and Gahlot et al. (2017) also conducted numerical experiments to quantify the impacts of
various natural and anthropogenic forcings on the dynamics
of the carbon cycle. They found that the net positive carbon
sink is maintained mostly by the carbon fertilization effect,
aided to some extent by forest conservation, management
and reforestation policies in the past decade. In an idealized
modeling study, Bala et al. (2011) showed that CO 2 -fertilization has the potential to alter the sign of terrestrial carbon
uptake over India. They found that modeled carbon stocks in
potential vegetation increased by 17 GtC with unlimited
fertilization for CO 2 levels and climate change corresponding to the end of the 21st century. However, the carbon stock
declined by 5.5 GtC when fertilization is limited at 1975
levels of CO 2 concentration. Thus, the benefits from CO 2
fertilization could be partially offset by land use/land cover
change and climate change (Bala et al. 2011). Further, the
model simulations of Bala et al. (2011) also implied that the
maximum potential terrestrial sequestration over India,
under equilibrium conditions and best-case scenario of
unlimited CO 2 fertilization, is only 18% of the
twenty-first-century SRES A2 scenario emissions from
India. The limited uptake potential suggests that reduction of
CO 2 emissions and afforestation programs should be top
priorities for India.
The broader trends, variability and drivers of the carbon
cycle dynamics over India were comprehensively addressed
by Rao et al. (2019) using the multi-model dataset TRENDY
for the period 1900–2010. Their analysis showed that the
TRENDY multi-model mean NPP shows a positive trend of
2.03% per decade over India during this period which is
consistent with a global greening in the last two decades
(Chen et al. 2019) and other studies such as Bala et al.
(2013) which showed an NPP increase of about 4% per
decade during the satellite era. Rao et al. (2019) also
analyzed the trends in water-use efficiency (WUE) of
ecosystem in India and found that WUE has increased by
25% during the period 1900–2010. Further, it was found that
the inter-annual variation in NPP and NEP over India is
strongly driven by precipitation, but remote drivers such as
El Nino–Southern Oscillation (ENSO) and Indian Ocean
Dipole (IOD) may not have a strong influence. The
multi-model-based estimate of the cumulative NEE is only
0.613 ± 0.1 PgC during 1901–2010, indicating that the
Indian terrestrial ecosystem was neither a strong source nor a
significant sink during this period. Among other studies,
Chakraborty et al. (1994) used proxy-based atmospheric and
surface ocean radiocarbon records to estimate the CO 2
exchange rate in the coastal region of Gujarat. Using a box
model approach, these authors have estimated CO 2 exchange
rate in the tune of 12 mol m
−2 yr
−1 .
4.4.2 Greenhouse gases Emission
and Projections
In this chapter, we present projections of future changes
based on the SSPs (Shared Socioeconomic Pathways)—a
suite of future forcing scenarios being used for the latest
generation of climate model (CMIP6) experiments. The
SSPs describe five possible future emissions trajectories
based on different narratives of socio-economic developments in the future. It may be noted that the future forcing
scenarios used by the previous generation of climate models
(CMIP5) were based on the Representative Concentration
Pathways (RCPs; see Chap. 1).
The future projection of GHGs emissions may be understood in light of the shared socioeconomic pathways (SSPs)
by climate change researcher community, which takes an
account of qualitative and quantitative trends in population
growth, economic development, urbanization and education
leading to future development of nations. The narratives of
these are discussed in detail in O’Neill et al. (2017). These
SSPs are developed using integrated assessment models.
These are considered to be new scenarios designed under 5
pathways, namely SSP1, SSP2, SSP3, SSP4 and SSP5 out of
which SSP1, SSP3, SSP4 and SSP5 are based on different
levels of challenges to climate adaptation and mitigation
while SSP2 is a median pathway considering a moderate
challenge to both (O’Neill et al. 2014, 2017). Briefly, these
SSPs are named and understood as:
Table 4.1 Comparison of net
biome productivity (TgC yr
−1
)
for the terrestrial ecosystems of
India estimated using different
approaches based on Gahlot et al.
(2017)
Decade
1980s
1990s
2000s
Process-based models
1.04 ± 46.75
34.65 ± 54.16
18.50 ± 48.40
Inverse models
–
45.22 ± 69.53
42.12 ± 67.40
ISAM
27.17
34.39
23.70
4 Observations and Modeling of GHG Concentrations and Fluxes …
85