

compared with the ground-based estimates (Dadhwal 2012).
Using SPOT VEGETATION 10-day NPP composites,
Chhabra and Dadhwal (2004) estimated the total net carbon
uptake by the Indian landmass to be 2.18 PgC y
−1 . Bala
et al. (2013) studied the trends and variability of the terrestrial net primary productivity over India for the period of
1982–2006 using the Advanced Very-High-Resolution
Radiometer (AVHRR)-derived data. These authors found
an increasing trend of 3.9% per decade over India, indicating
an increased rate of carbon fixation by the terrestrial
ecosystems during the past two decades. NPP estimates
based on Dynamic Land Ecosystem Model for the 1901–
2000 period also show an increasing trend, from 1.2 to
1.7 PgC yr
−1 (see Sect. 4.4.1). These observations also
support our hypothesis of increasing CO 2 amplitude due to
increasing biospheric activity (discussed in Sect. 4.3.1).
According to Watham et al. (2017), the MOD17 product by
MODIS is a severe underestimation of the actual GPP
calculated from both surface measurements and
remote-sensing-driven models. Deb Burman et al. (2017)
showed that MODIS LAI fails to capture the seasonality in
the leaf phenology which can lead to significant error in the
GPP estimate if used as input in process-based models.
Ground observations over different ecosystems and satellite
products are combined together for a countrywide estimate
of carbon sequestration by Nayak et al. (2013). According to
their study, broadleaf evergreen forests are the largest contributor to the annual carbon storage followed by broadleaf
deciduous forests. Annual NEE of these ecosystems is
−1057 gC m
−2 y
−1 and −658 gC m
−2 y
−1 , respectively.
Additionally, this upscaling study also reports an estimated
growth rate of 0.005 PgC y
−1 in the annual carbon sequestration over the Indian region.
Apart from the surface flux measurements, satellite
observations are also used to estimate the GHGs fluxes.
Valsala et al. (2013) studied the intra-seasonal oscillations in
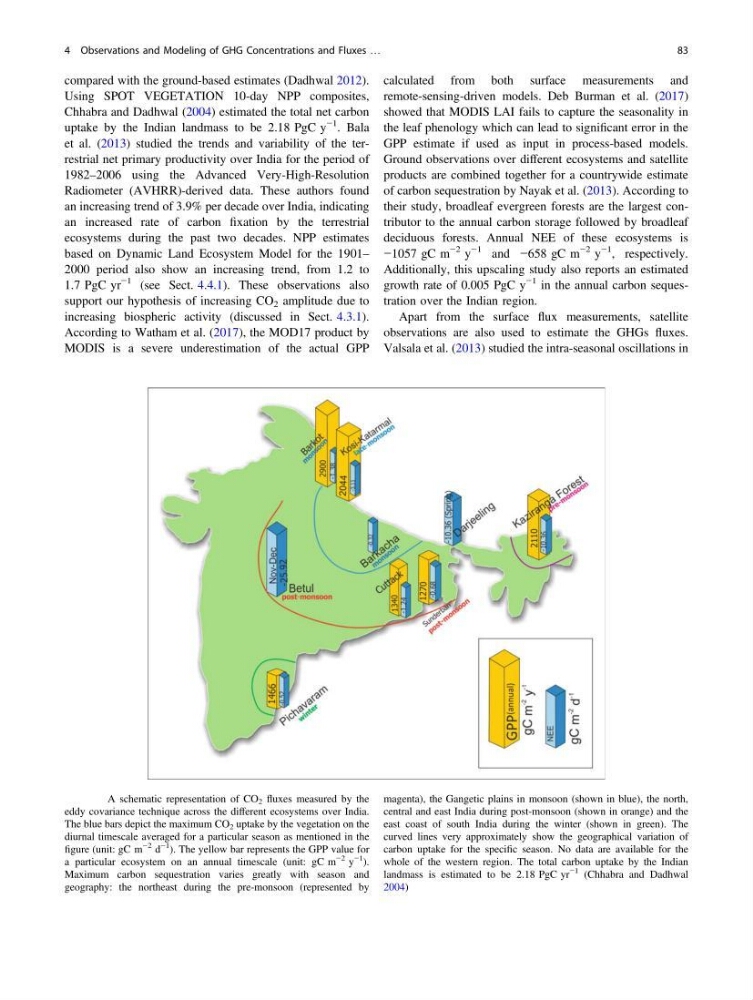
Fig. 4.5 A schematic representation of CO 2 fluxes measured by the
eddy covariance technique across the different ecosystems over India.
The blue bars depict the maximum CO 2 uptake by the vegetation on the
diurnal timescale averaged for a particular season as mentioned in the
figure (unit: gC m
−2 d
−1
). The yellow bar represents the GPP value for
a particular ecosystem on an annual timescale (unit: gC m
−2 y
−1
).
Maximum carbon sequestration varies greatly with season and
geography: the northeast during the pre-monsoon (represented by
magenta), the Gangetic plains in monsoon (shown in blue), the north,
central and east India during post-monsoon (shown in orange) and the
east coast of south India during the winter (shown in green). The
curved lines very approximately show the geographical variation of
carbon uptake for the specific season. No data are available for the
whole of the western region. The total carbon uptake by the Indian
landmass is estimated to be 2.18 PgC yr
−1 (Chhabra and Dadhwal
2004)
4 Observations and Modeling of GHG Concentrations and Fluxes …
83
Using SPOT VEGETATION 10-day NPP composites,
Chhabra and Dadhwal (2004) estimated the total net carbon
uptake by the Indian landmass to be 2.18 PgC y
−1 . Bala
et al. (2013) studied the trends and variability of the terrestrial net primary productivity over India for the period of
1982–2006 using the Advanced Very-High-Resolution
Radiometer (AVHRR)-derived data. These authors found
an increasing trend of 3.9% per decade over India, indicating
an increased rate of carbon fixation by the terrestrial
ecosystems during the past two decades. NPP estimates
based on Dynamic Land Ecosystem Model for the 1901–
2000 period also show an increasing trend, from 1.2 to
1.7 PgC yr
−1 (see Sect. 4.4.1). These observations also
support our hypothesis of increasing CO 2 amplitude due to
increasing biospheric activity (discussed in Sect. 4.3.1).
According to Watham et al. (2017), the MOD17 product by
MODIS is a severe underestimation of the actual GPP
calculated from both surface measurements and
remote-sensing-driven models. Deb Burman et al. (2017)
showed that MODIS LAI fails to capture the seasonality in
the leaf phenology which can lead to significant error in the
GPP estimate if used as input in process-based models.
Ground observations over different ecosystems and satellite
products are combined together for a countrywide estimate
of carbon sequestration by Nayak et al. (2013). According to
their study, broadleaf evergreen forests are the largest contributor to the annual carbon storage followed by broadleaf
deciduous forests. Annual NEE of these ecosystems is
−1057 gC m
−2 y
−1 and −658 gC m
−2 y
−1 , respectively.
Additionally, this upscaling study also reports an estimated
growth rate of 0.005 PgC y
−1 in the annual carbon sequestration over the Indian region.
Apart from the surface flux measurements, satellite
observations are also used to estimate the GHGs fluxes.
Valsala et al. (2013) studied the intra-seasonal oscillations in
Fig. 4.5 A schematic representation of CO 2 fluxes measured by the
eddy covariance technique across the different ecosystems over India.
The blue bars depict the maximum CO 2 uptake by the vegetation on the
diurnal timescale averaged for a particular season as mentioned in the
figure (unit: gC m
−2 d
−1
). The yellow bar represents the GPP value for
a particular ecosystem on an annual timescale (unit: gC m
−2 y
−1
).
Maximum carbon sequestration varies greatly with season and
geography: the northeast during the pre-monsoon (represented by
magenta), the Gangetic plains in monsoon (shown in blue), the north,
central and east India during post-monsoon (shown in orange) and the
east coast of south India during the winter (shown in green). The
curved lines very approximately show the geographical variation of
carbon uptake for the specific season. No data are available for the
whole of the western region. The total carbon uptake by the Indian
landmass is estimated to be 2.18 PgC yr
−1 (Chhabra and Dadhwal
2004)
4 Observations and Modeling of GHG Concentrations and Fluxes …
83