

7.4 χ 2 -Distribution
79
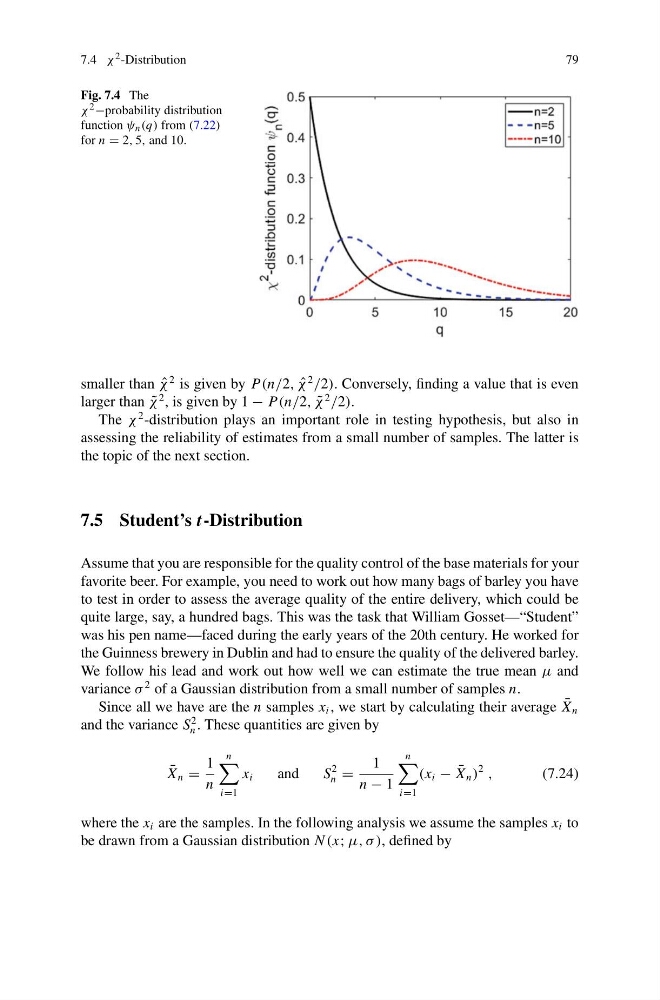
Fig. 7.4 The
χ 2 −probability distribution
function ψ n (q) from (7.22)
for n = 2, 5, and 10.
smaller than ˆ
χ
2 is given by P(n/2, ˆ
χ
2
/2). Conversely, finding a value that is even
larger than ˜
χ
2 , is given by 1 − P(n/2, ˜
χ
2
/2).
The χ
2 -distribution plays an important role in testing hypothesis, but also in
assessing the reliability of estimates from a small number of samples. The latter is
the topic of the next section.
7.5 Student’s t-Distribution
Assume that you are responsible for the quality control of the base materials for your
favorite beer. For example, you need to work out how many bags of barley you have
to test in order to assess the average quality of the entire delivery, which could be
quite large, say, a hundred bags. This was the task that William Gosset—“Student”
was his pen name—faced during the early years of the 20th century. He worked for
the Guinness brewery in Dublin and had to ensure the quality of the delivered barley.
We follow his lead and work out how well we can estimate the true mean μ and
variance σ
2 of a Gaussian distribution from a small number of samples n.
Since all we have are the n samples x i , we start by calculating their average ¯
X n
and the variance S
2
n . These quantities are given by
¯
X n =
1
n
n
i=1
x i
and
S
2
n =
1
n − 1
n
i=1
(x i − ¯
X n )
2
,
(7.24)
where the x i are the samples. In the following analysis we assume the samples x i to
be drawn from a Gaussian distribution N (x; μ, σ ), defined by
79
Fig. 7.4 The
χ 2 −probability distribution
function ψ n (q) from (7.22)
for n = 2, 5, and 10.
smaller than ˆ
χ
2 is given by P(n/2, ˆ
χ
2
/2). Conversely, finding a value that is even
larger than ˜
χ
2 , is given by 1 − P(n/2, ˜
χ
2
/2).
The χ
2 -distribution plays an important role in testing hypothesis, but also in
assessing the reliability of estimates from a small number of samples. The latter is
the topic of the next section.
7.5 Student’s t-Distribution
Assume that you are responsible for the quality control of the base materials for your
favorite beer. For example, you need to work out how many bags of barley you have
to test in order to assess the average quality of the entire delivery, which could be
quite large, say, a hundred bags. This was the task that William Gosset—“Student”
was his pen name—faced during the early years of the 20th century. He worked for
the Guinness brewery in Dublin and had to ensure the quality of the delivered barley.
We follow his lead and work out how well we can estimate the true mean μ and
variance σ
2 of a Gaussian distribution from a small number of samples n.
Since all we have are the n samples x i , we start by calculating their average ¯
X n
and the variance S
2
n . These quantities are given by
¯
X n =
1
n
n
i=1
x i
and
S
2
n =
1
n − 1
n
i=1
(x i − ¯
X n )
2
,
(7.24)
where the x i are the samples. In the following analysis we assume the samples x i to
be drawn from a Gaussian distribution N (x; μ, σ ), defined by