

6.4 Tailoring Risk to One’s Desire
67
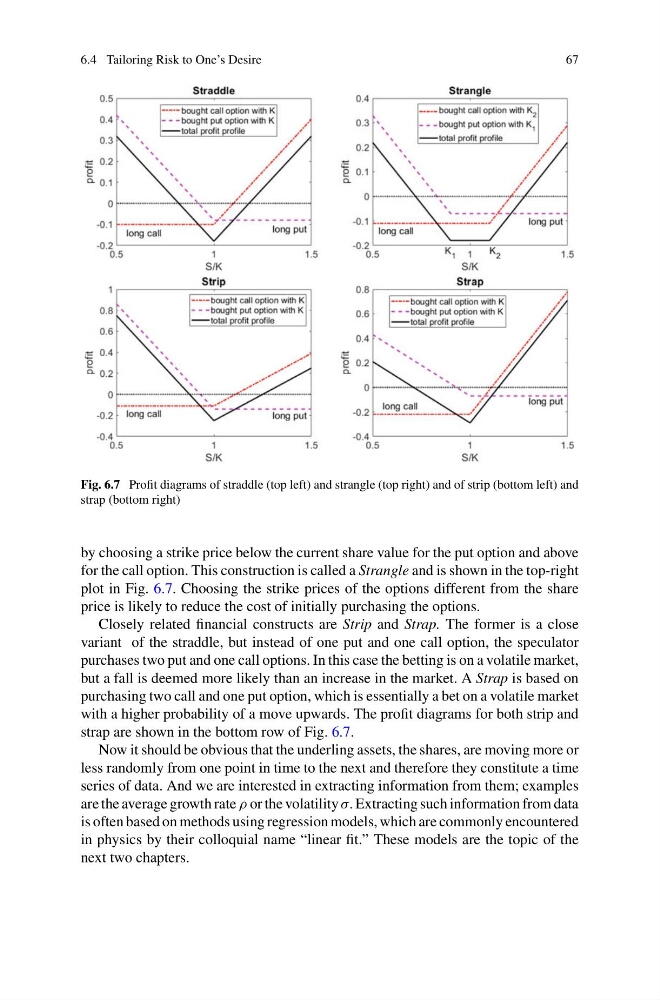
Fig. 6.7 Profit diagrams of straddle (top left) and strangle (top right) and of strip (bottom left) and
strap (bottom right)
by choosing a strike price below the current share value for the put option and above
for the call option. This construction is called a Strangle and is shown in the top-right
plot in Fig. 6.7. Choosing the strike prices of the options different from the share
price is likely to reduce the cost of initially purchasing the options.
Closely related financial constructs are Strip and Strap. The former is a close
variant of the straddle, but instead of one put and one call option, the speculator
purchases two put and one call options. In this case the betting is on a volatile market,
but a fall is deemed more likely than an increase in the market. A Strap is based on
purchasing two call and one put option, which is essentially a bet on a volatile market
with a higher probability of a move upwards. The profit diagrams for both strip and
strap are shown in the bottom row of Fig. 6.7.
Now it should be obvious that the underling assets, the shares, are moving more or
less randomly from one point in time to the next and therefore they constitute a time
series of data. And we are interested in extracting information from them; examples
are the average growth rate ρ or the volatility σ. Extracting such information from data
is often based on methods using regression models, which are commonly encountered
in physics by their colloquial name “linear fit.” These models are the topic of the
next two chapters.
67
Fig. 6.7 Profit diagrams of straddle (top left) and strangle (top right) and of strip (bottom left) and
strap (bottom right)
by choosing a strike price below the current share value for the put option and above
for the call option. This construction is called a Strangle and is shown in the top-right
plot in Fig. 6.7. Choosing the strike prices of the options different from the share
price is likely to reduce the cost of initially purchasing the options.
Closely related financial constructs are Strip and Strap. The former is a close
variant of the straddle, but instead of one put and one call option, the speculator
purchases two put and one call options. In this case the betting is on a volatile market,
but a fall is deemed more likely than an increase in the market. A Strap is based on
purchasing two call and one put option, which is essentially a bet on a volatile market
with a higher probability of a move upwards. The profit diagrams for both strip and
strap are shown in the bottom row of Fig. 6.7.
Now it should be obvious that the underling assets, the shares, are moving more or
less randomly from one point in time to the next and therefore they constitute a time
series of data. And we are interested in extracting information from them; examples
are the average growth rate ρ or the volatility σ. Extracting such information from data
is often based on methods using regression models, which are commonly encountered
in physics by their colloquial name “linear fit.” These models are the topic of the
next two chapters.