

6.4 Tailoring Risk to One’s Desire
65
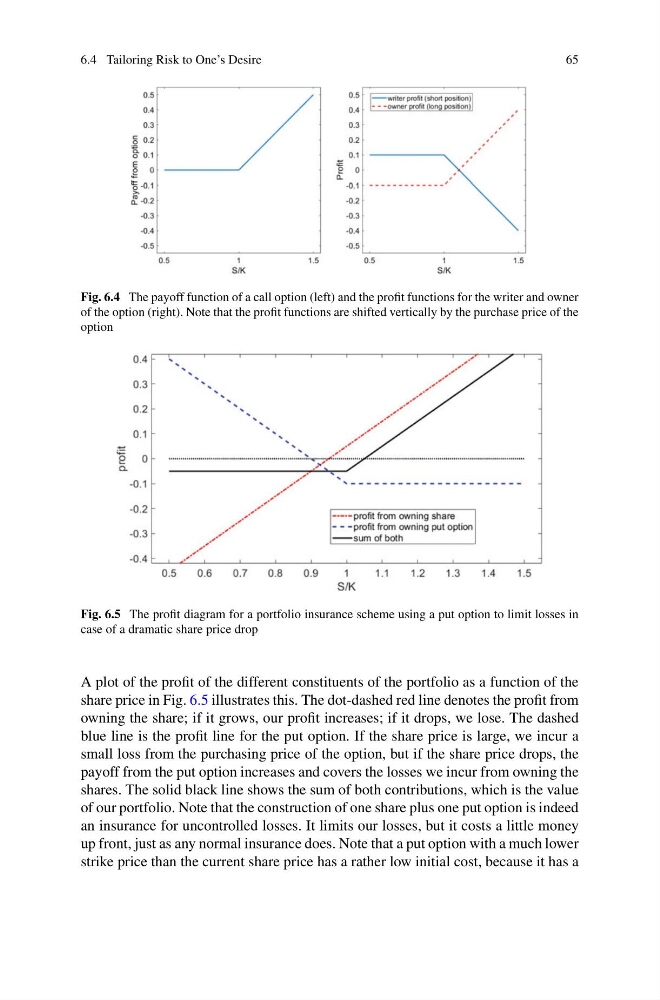
Fig. 6.4 The payoff function of a call option (left) and the profit functions for the writer and owner
of the option (right). Note that the profit functions are shifted vertically by the purchase price of the
option
Fig. 6.5 The profit diagram for a portfolio insurance scheme using a put option to limit losses in
case of a dramatic share price drop
A plot of the profit of the different constituents of the portfolio as a function of the
share price in Fig. 6.5 illustrates this. The dot-dashed red line denotes the profit from
owning the share; if it grows, our profit increases; if it drops, we lose. The dashed
blue line is the profit line for the put option. If the share price is large, we incur a
small loss from the purchasing price of the option, but if the share price drops, the
payoff from the put option increases and covers the losses we incur from owning the
shares. The solid black line shows the sum of both contributions, which is the value
of our portfolio. Note that the construction of one share plus one put option is indeed
an insurance for uncontrolled losses. It limits our losses, but it costs a little money
up front, just as any normal insurance does. Note that a put option with a much lower
strike price than the current share price has a rather low initial cost, because it has a
65
Fig. 6.4 The payoff function of a call option (left) and the profit functions for the writer and owner
of the option (right). Note that the profit functions are shifted vertically by the purchase price of the
option
Fig. 6.5 The profit diagram for a portfolio insurance scheme using a put option to limit losses in
case of a dramatic share price drop
A plot of the profit of the different constituents of the portfolio as a function of the
share price in Fig. 6.5 illustrates this. The dot-dashed red line denotes the profit from
owning the share; if it grows, our profit increases; if it drops, we lose. The dashed
blue line is the profit line for the put option. If the share price is large, we incur a
small loss from the purchasing price of the option, but if the share price drops, the
payoff from the put option increases and covers the losses we incur from owning the
shares. The solid black line shows the sum of both contributions, which is the value
of our portfolio. Note that the construction of one share plus one put option is indeed
an insurance for uncontrolled losses. It limits our losses, but it costs a little money
up front, just as any normal insurance does. Note that a put option with a much lower
strike price than the current share price has a rather low initial cost, because it has a