

6.2 Volatility Smile
63
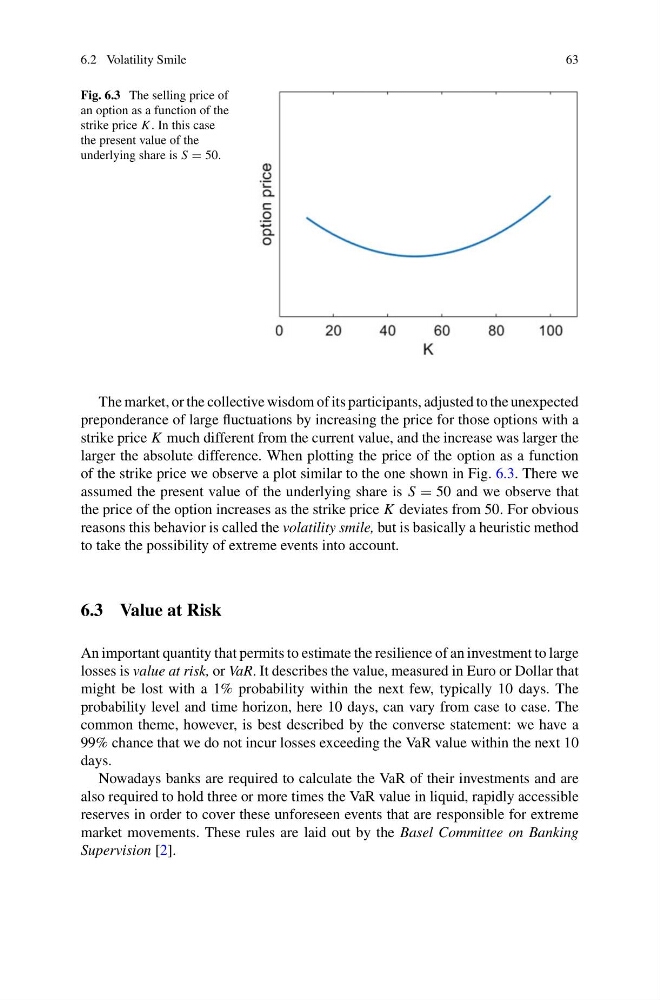
Fig. 6.3 The selling price of
an option as a function of the
strike price K . In this case
the present value of the
underlying share is S = 50.
The market, or the collective wisdom of its participants, adjusted to the unexpected
preponderance of large fluctuations by increasing the price for those options with a
strike price K much different from the current value, and the increase was larger the
larger the absolute difference. When plotting the price of the option as a function
of the strike price we observe a plot similar to the one shown in Fig. 6.3. There we
assumed the present value of the underlying share is S = 50 and we observe that
the price of the option increases as the strike price K deviates from 50. For obvious
reasons this behavior is called the volatility smile, but is basically a heuristic method
to take the possibility of extreme events into account.
6.3 Value at Risk
An important quantity that permits to estimate the resilience of an investment to large
losses is value at risk, or VaR. It describes the value, measured in Euro or Dollar that
might be lost with a 1% probability within the next few, typically 10 days. The
probability level and time horizon, here 10 days, can vary from case to case. The
common theme, however, is best described by the converse statement: we have a
99% chance that we do not incur losses exceeding the VaR value within the next 10
days.
Nowadays banks are required to calculate the VaR of their investments and are
also required to hold three or more times the VaR value in liquid, rapidly accessible
reserves in order to cover these unforeseen events that are responsible for extreme
market movements. These rules are laid out by the Basel Committee on Banking
Supervision [2].
63
Fig. 6.3 The selling price of
an option as a function of the
strike price K . In this case
the present value of the
underlying share is S = 50.
The market, or the collective wisdom of its participants, adjusted to the unexpected
preponderance of large fluctuations by increasing the price for those options with a
strike price K much different from the current value, and the increase was larger the
larger the absolute difference. When plotting the price of the option as a function
of the strike price we observe a plot similar to the one shown in Fig. 6.3. There we
assumed the present value of the underlying share is S = 50 and we observe that
the price of the option increases as the strike price K deviates from 50. For obvious
reasons this behavior is called the volatility smile, but is basically a heuristic method
to take the possibility of extreme events into account.
6.3 Value at Risk
An important quantity that permits to estimate the resilience of an investment to large
losses is value at risk, or VaR. It describes the value, measured in Euro or Dollar that
might be lost with a 1% probability within the next few, typically 10 days. The
probability level and time horizon, here 10 days, can vary from case to case. The
common theme, however, is best described by the converse statement: we have a
99% chance that we do not incur losses exceeding the VaR value within the next 10
days.
Nowadays banks are required to calculate the VaR of their investments and are
also required to hold three or more times the VaR value in liquid, rapidly accessible
reserves in order to cover these unforeseen events that are responsible for extreme
market movements. These rules are laid out by the Basel Committee on Banking
Supervision [2].