

134
9 Bubbles, Crashes, Fat Tails and Lévy-Stable Distributions
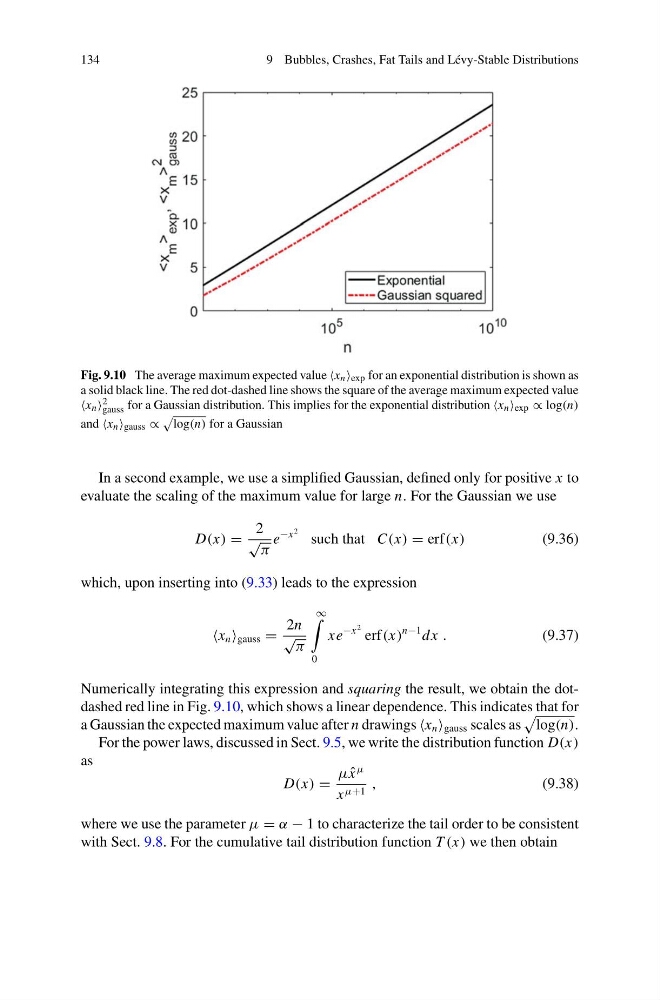
Fig. 9.10 The average maximum expected value x n exp for an exponential distribution is shown as
a solid black line. The red dot-dashed line shows the square of the average maximum expected value
x n 2
gauss for a Gaussian distribution. This implies for the exponential distribution x n exp ∝ log(n)
and x n gauss ∝
log(n) for a Gaussian
In a second example, we use a simplified Gaussian, defined only for positive x to
evaluate the scaling of the maximum value for large n. For the Gaussian we use
D(x) =
2
√
π
e
−x
2
such that C(x) = erf(x)
(9.36)
which, upon inserting into (9.33) leads to the expression
x n gauss =
2n
√ π
∞
0
xe
−x
2 erf(x)
n−1 dx .
(9.37)
Numerically integrating this expression and squaring the result, we obtain the dotdashed red line in Fig. 9.10, which shows a linear dependence. This indicates that for
a Gaussian the expected maximum value after n drawings x n gauss scales as
log(n).
For the power laws, discussed in Sect. 9.5, we write the distribution function D(x)
as
D(x) =
μ ˆ
x
μ
x μ+1 ,
(9.38)
where we use the parameter μ = α − 1 to characterize the tail order to be consistent
with Sect. 9.8. For the cumulative tail distribution function T (x) we then obtain
9 Bubbles, Crashes, Fat Tails and Lévy-Stable Distributions
Fig. 9.10 The average maximum expected value x n exp for an exponential distribution is shown as
a solid black line. The red dot-dashed line shows the square of the average maximum expected value
x n 2
gauss for a Gaussian distribution. This implies for the exponential distribution x n exp ∝ log(n)
and x n gauss ∝
log(n) for a Gaussian
In a second example, we use a simplified Gaussian, defined only for positive x to
evaluate the scaling of the maximum value for large n. For the Gaussian we use
D(x) =
2
√
π
e
−x
2
such that C(x) = erf(x)
(9.36)
which, upon inserting into (9.33) leads to the expression
x n gauss =
2n
√ π
∞
0
xe
−x
2 erf(x)
n−1 dx .
(9.37)
Numerically integrating this expression and squaring the result, we obtain the dotdashed red line in Fig. 9.10, which shows a linear dependence. This indicates that for
a Gaussian the expected maximum value after n drawings x n gauss scales as
log(n).
For the power laws, discussed in Sect. 9.5, we write the distribution function D(x)
as
D(x) =
μ ˆ
x
μ
x μ+1 ,
(9.38)
where we use the parameter μ = α − 1 to characterize the tail order to be consistent
with Sect. 9.8. For the cumulative tail distribution function T (x) we then obtain