

2.7 Active Fluids with Different Symmetries
41
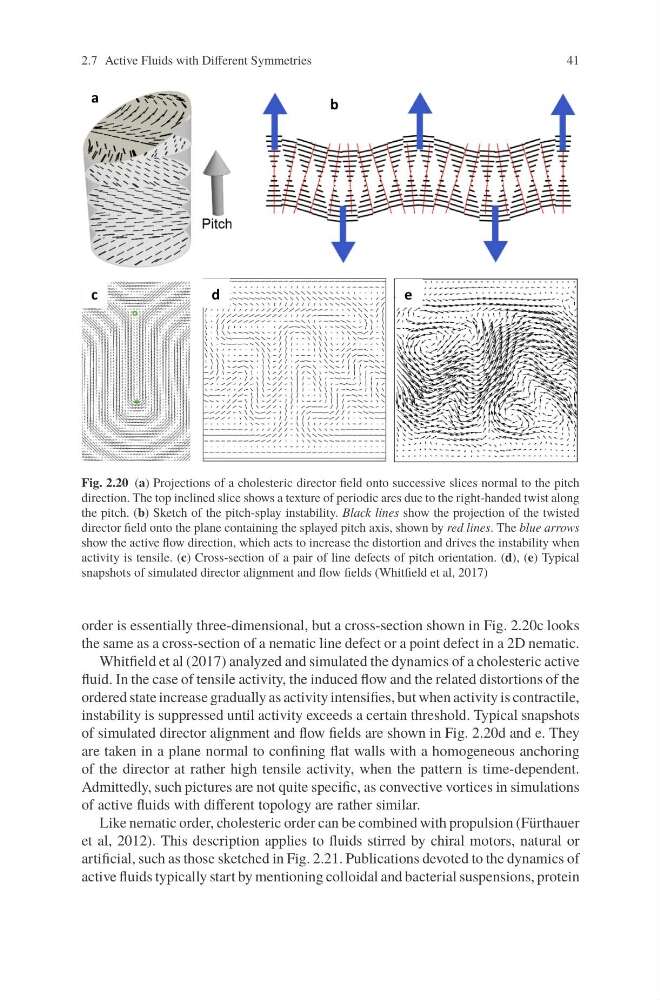
Fig. 2.20 (a) Projections of a cholesteric director field onto successive slices normal to the pitch
direction. The top inclined slice shows a texture of periodic arcs due to the right-handed twist along
the pitch. (b) Sketch of the pitch-splay instability. Black lines show the projection of the twisted
director field onto the plane containing the splayed pitch axis, shown by red lines. The blue arrows
show the active flow direction, which acts to increase the distortion and drives the instability when
activity is tensile. (c) Cross-section of a pair of line defects of pitch orientation. (d), (e) Typical
snapshots of simulated director alignment and flow fields (Whitfield et al, 2017)
order is essentially three-dimensional, but a cross-section shown in Fig. 2.20c looks
the same as a cross-section of a nematic line defect or a point defect in a 2D nematic.
Whitfield et al (2017) analyzed and simulated the dynamics of a cholesteric active
fluid. In the case of tensile activity, the induced flow and the related distortions of the
ordered state increase gradually as activity intensifies, but when activity is contractile,
instability is suppressed until activity exceeds a certain threshold. Typical snapshots
of simulated director alignment and flow fields are shown in Fig. 2.20d and e. They
are taken in a plane normal to confining flat walls with a homogeneous anchoring
of the director at rather high tensile activity, when the pattern is time-dependent.
Admittedly, such pictures are not quite specific, as convective vortices in simulations
of active fluids with different topology are rather similar.
Like nematic order, cholesteric order can be combined with propulsion (Fürthauer
et al, 2012). This description applies to fluids stirred by chiral motors, natural or
artificial, such as those sketched in Fig. 2.21. Publications devoted to the dynamics of
active fluids typically start by mentioning colloidal and bacterial suspensions, protein
41
Fig. 2.20 (a) Projections of a cholesteric director field onto successive slices normal to the pitch
direction. The top inclined slice shows a texture of periodic arcs due to the right-handed twist along
the pitch. (b) Sketch of the pitch-splay instability. Black lines show the projection of the twisted
director field onto the plane containing the splayed pitch axis, shown by red lines. The blue arrows
show the active flow direction, which acts to increase the distortion and drives the instability when
activity is tensile. (c) Cross-section of a pair of line defects of pitch orientation. (d), (e) Typical
snapshots of simulated director alignment and flow fields (Whitfield et al, 2017)
order is essentially three-dimensional, but a cross-section shown in Fig. 2.20c looks
the same as a cross-section of a nematic line defect or a point defect in a 2D nematic.
Whitfield et al (2017) analyzed and simulated the dynamics of a cholesteric active
fluid. In the case of tensile activity, the induced flow and the related distortions of the
ordered state increase gradually as activity intensifies, but when activity is contractile,
instability is suppressed until activity exceeds a certain threshold. Typical snapshots
of simulated director alignment and flow fields are shown in Fig. 2.20d and e. They
are taken in a plane normal to confining flat walls with a homogeneous anchoring
of the director at rather high tensile activity, when the pattern is time-dependent.
Admittedly, such pictures are not quite specific, as convective vortices in simulations
of active fluids with different topology are rather similar.
Like nematic order, cholesteric order can be combined with propulsion (Fürthauer
et al, 2012). This description applies to fluids stirred by chiral motors, natural or
artificial, such as those sketched in Fig. 2.21. Publications devoted to the dynamics of
active fluids typically start by mentioning colloidal and bacterial suspensions, protein