

inputting numbers that were rounded-off by the computer rather than the exact ones,
he had introduced errors to the calculations and these had amplified—and created
Chaos.
Lorenz considered the implications that the calculations in his model had on the
real world—that not accurately measuring temperature, wind and so forth to three
decimal places meant that long-range weather forecasting was impossible. He came
to believe that it was this “amplification” of small differences that caused the lack of
periodicity in his computations (Lorenz 2005a, pp. 134–135).
Then, in the worksheets delivered to the students, there is a discussion of the
extract from Lorentz, and certain questions are posed to the students about this
historical text.
As auxiliary tools, instruments such as a Chaos Pendulum (PASCO 2017) and
forms of software such as NetLogo (Wilensky 1998, 1999) are utilised in order to
represent chaotic (Head and Wilensky 2017) and/or Complex System’s comportment in real circumstances, for didactical reasons. In Figs. 20.3 and 20.4, images of
the aforementioned teaching tools are shown.
Finally, activities with pen, pencil and paper or with other simple materials
(Peitgen et al. 1991) help the learning subjects to “create” chaotic conditions or
time-evolutions and patterns by themselves. One such activity is the “chaos game”
depicted in Fig. 20.5.
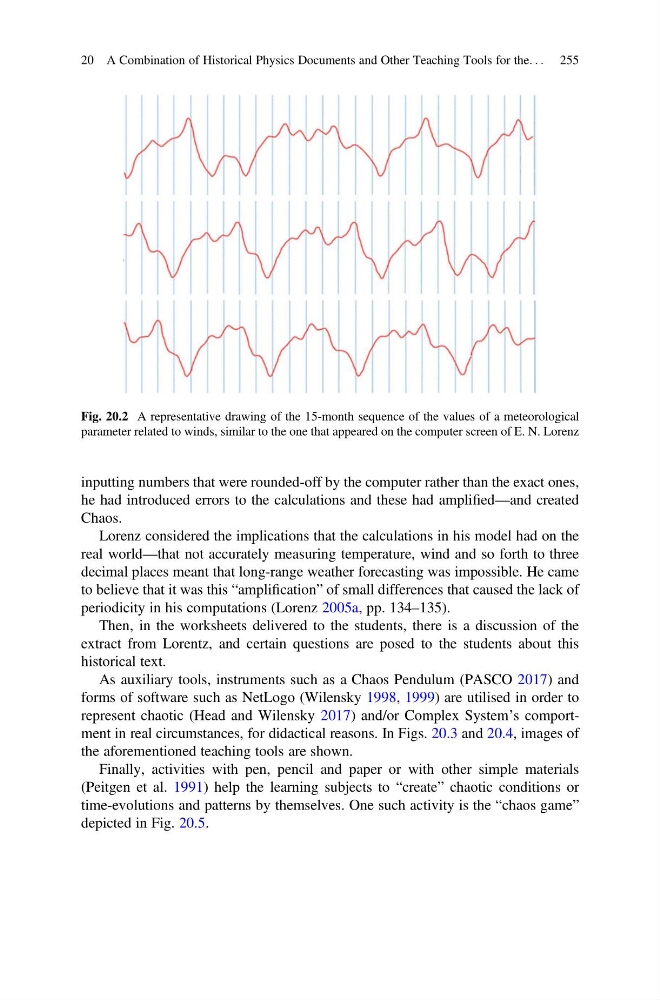
Fig. 20.2 A representative drawing of the 15-month sequence of the values of a meteorological
parameter related to winds, similar to the one that appeared on the computer screen of E. N. Lorenz
20 A Combination of Historical Physics Documents and Other Teaching Tools for the. . . 255
he had introduced errors to the calculations and these had amplified—and created
Chaos.
Lorenz considered the implications that the calculations in his model had on the
real world—that not accurately measuring temperature, wind and so forth to three
decimal places meant that long-range weather forecasting was impossible. He came
to believe that it was this “amplification” of small differences that caused the lack of
periodicity in his computations (Lorenz 2005a, pp. 134–135).
Then, in the worksheets delivered to the students, there is a discussion of the
extract from Lorentz, and certain questions are posed to the students about this
historical text.
As auxiliary tools, instruments such as a Chaos Pendulum (PASCO 2017) and
forms of software such as NetLogo (Wilensky 1998, 1999) are utilised in order to
represent chaotic (Head and Wilensky 2017) and/or Complex System’s comportment in real circumstances, for didactical reasons. In Figs. 20.3 and 20.4, images of
the aforementioned teaching tools are shown.
Finally, activities with pen, pencil and paper or with other simple materials
(Peitgen et al. 1991) help the learning subjects to “create” chaotic conditions or
time-evolutions and patterns by themselves. One such activity is the “chaos game”
depicted in Fig. 20.5.
Fig. 20.2 A representative drawing of the 15-month sequence of the values of a meteorological
parameter related to winds, similar to the one that appeared on the computer screen of E. N. Lorenz
20 A Combination of Historical Physics Documents and Other Teaching Tools for the. . . 255