

extension (contexts) and intension (main features). Then (30 min), they explored
qualitatively the diffraction figure collected on a white screen and produced by a
single slit, to recognize the general features of the phenomenon: the angular nature
and symmetry of the distribution, the regular alternation of maxima and minima, the
very intense central maximum and the progressively decreasing intensity of other
maxima, parameters affecting the pattern (D—distance screen-slit, λ—laser colour
or wavelength, a—width of the slit). The partial conclusions obtained by each group
were shared in a large group discussion. Students were requested to design alone
(15–30 min) and then perform experiments in little groups to characterize quantitatively the phenomenology of diffraction (1.5–2 h). They used in lab the online sensor
system Lucegrafo (Gervasio and Michelini 2009), to perform the real-time acquisition of the diffraction distributions, analysed at school under the supervision of the
schoolteachers after.
The second stage, conducted by a researcher at school, included three parts. In the
first part (1–1.5 h), the data analysis were resumed discussing the data collected by
the students in the lab, posing the question to model the phenomenon with an
assumption on the wave nature of light. In the second part (0.5 h), students simulated
the interference of waves produced by two point sources superposing and moving
the circles drawn on a transparent foil over these drawn on a white paper and
exploring the condition for maxima/minima nodal lines (McDermott et al. 2012).
The third part (0.5 h) involved students in the discussion of the meaning of
superposition of wave and its mathematical implementation to acquire the minima
instruments to construct a formal model accounting and interpreting the single slit
diffraction distribution analysed in the lab. In the fourth part (0.5 h), the layout of the
model based on Huygens principle was discussed with students, considering the
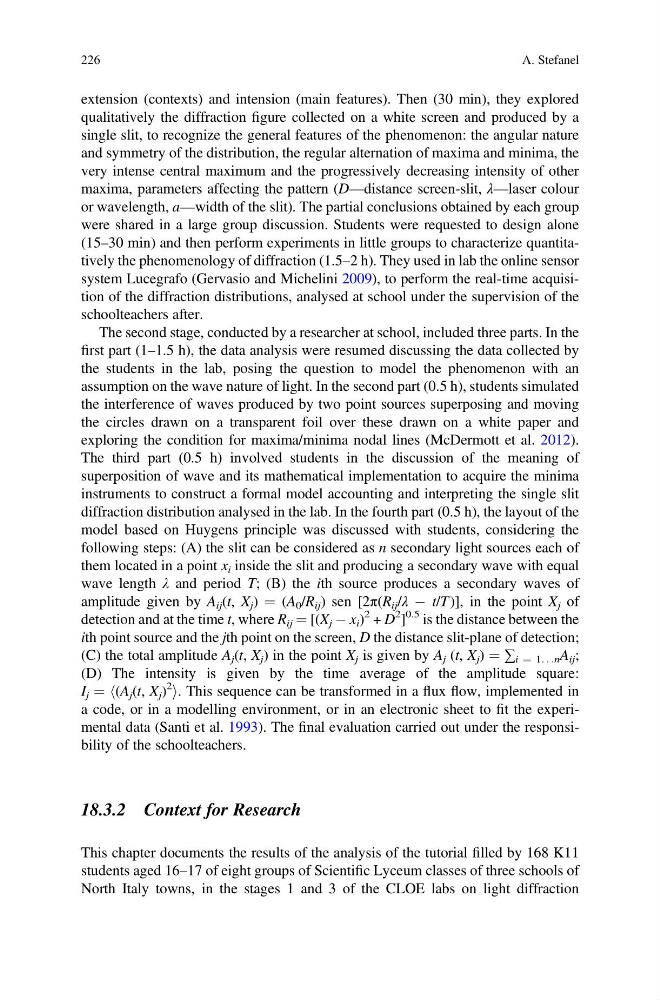
following steps: (A) the slit can be considered as n secondary light sources each of
them located in a point x i inside the slit and producing a secondary wave with equal
wave length λ and period T; (B) the ith source produces a secondary waves of
amplitude given by A ij (t, X j ) ¼ (A 0 /R ij ) sen [2π(R ij /λ À t/T )], in the point X j of
detection and at the time t, where R ij ¼ [(X j À x i )
2 + D
2 ]
0.5 is the distance between the
ith point source and the jth point on the screen, D the distance slit-plane of detection;
(C) the total amplitude A j (t, X j ) in the point X j is given by A j (t, X j ) ¼ ∑ i ¼ 1. . .n A ij ;
(D) The intensity is given by the time average of the amplitude square:
I j ¼ h(A j (t, X j )
2
i. This sequence can be transformed in a flux flow, implemented in
a code, or in a modelling environment, or in an electronic sheet to fit the experimental data (Santi et al. 1993). The final evaluation carried out under the responsibility of the schoolteachers.
18.3.2 Context for Research
This chapter documents the results of the analysis of the tutorial filled by 168 K11
students aged 16–17 of eight groups of Scientific Lyceum classes of three schools of
North Italy towns, in the stages 1 and 3 of the CLOE labs on light diffraction
226
A. Stefanel
qualitatively the diffraction figure collected on a white screen and produced by a
single slit, to recognize the general features of the phenomenon: the angular nature
and symmetry of the distribution, the regular alternation of maxima and minima, the
very intense central maximum and the progressively decreasing intensity of other
maxima, parameters affecting the pattern (D—distance screen-slit, λ—laser colour
or wavelength, a—width of the slit). The partial conclusions obtained by each group
were shared in a large group discussion. Students were requested to design alone
(15–30 min) and then perform experiments in little groups to characterize quantitatively the phenomenology of diffraction (1.5–2 h). They used in lab the online sensor
system Lucegrafo (Gervasio and Michelini 2009), to perform the real-time acquisition of the diffraction distributions, analysed at school under the supervision of the
schoolteachers after.
The second stage, conducted by a researcher at school, included three parts. In the
first part (1–1.5 h), the data analysis were resumed discussing the data collected by
the students in the lab, posing the question to model the phenomenon with an
assumption on the wave nature of light. In the second part (0.5 h), students simulated
the interference of waves produced by two point sources superposing and moving
the circles drawn on a transparent foil over these drawn on a white paper and
exploring the condition for maxima/minima nodal lines (McDermott et al. 2012).
The third part (0.5 h) involved students in the discussion of the meaning of
superposition of wave and its mathematical implementation to acquire the minima
instruments to construct a formal model accounting and interpreting the single slit
diffraction distribution analysed in the lab. In the fourth part (0.5 h), the layout of the
model based on Huygens principle was discussed with students, considering the
following steps: (A) the slit can be considered as n secondary light sources each of
them located in a point x i inside the slit and producing a secondary wave with equal
wave length λ and period T; (B) the ith source produces a secondary waves of
amplitude given by A ij (t, X j ) ¼ (A 0 /R ij ) sen [2π(R ij /λ À t/T )], in the point X j of
detection and at the time t, where R ij ¼ [(X j À x i )
2 + D
2 ]
0.5 is the distance between the
ith point source and the jth point on the screen, D the distance slit-plane of detection;
(C) the total amplitude A j (t, X j ) in the point X j is given by A j (t, X j ) ¼ ∑ i ¼ 1. . .n A ij ;
(D) The intensity is given by the time average of the amplitude square:
I j ¼ h(A j (t, X j )
2
i. This sequence can be transformed in a flux flow, implemented in
a code, or in a modelling environment, or in an electronic sheet to fit the experimental data (Santi et al. 1993). The final evaluation carried out under the responsibility of the schoolteachers.
18.3.2 Context for Research
This chapter documents the results of the analysis of the tutorial filled by 168 K11
students aged 16–17 of eight groups of Scientific Lyceum classes of three schools of
North Italy towns, in the stages 1 and 3 of the CLOE labs on light diffraction
226
A. Stefanel