

The spectra at v E = 1, 2 and v b = 2 levels have features with nearly the same
energetic spacings and intensity profiles as those in the spectra given in Fig. 6.36.
The similarities of the features in Fig. 6.36a, b (transitions from HeI
35 Cl(X,0,n X = 1)
of the T-shaped configuration) suggest that the HeI
35 Cl(A,1,n A = 0) vdW state is
also T-shaped, as the HeI
35 Cl(B,2,n B = 0) one (see Fig. 6.34d). One can assume that
the HeI
35
Cl(E,11, n
b
E ,, n
str
E and b,1, n
b
b , n
str
b ) states also have significant probability
amplitude in the T-shaped region of the intermolecular PESs (see [28]). Energies of
the HeI
35 Cl(E,v E = 11,12, n
b
E ,, n
str
E and b,v b = 1,2, n
b
b , n
str
b ) vdW levels (cm
−1 ) relative to the HeI
35 Cl(E,v E and b,v b ) dissociation limits are given in Table 6.11.
The binding energies of the T-shaped HeI
35 Cl(B,3 and A,15) complexes are 13.4
(4) and 13.4(3) cm
−1 , respectively. Lifetime of the T-shaped HeI
35 Cl(B,2) complexes is 550 ps [117]. The binding energies of the T-shaped HeI
35 Cl(E,12 and b,1)
complexes are equal to 41(1) and 39.2(4) cm
−1 , respectively. Nonadiabatic coupling between specific vdW modes of the He
35 ICl(b,v b and D
0
; v D 0 ) states takes
place [28].
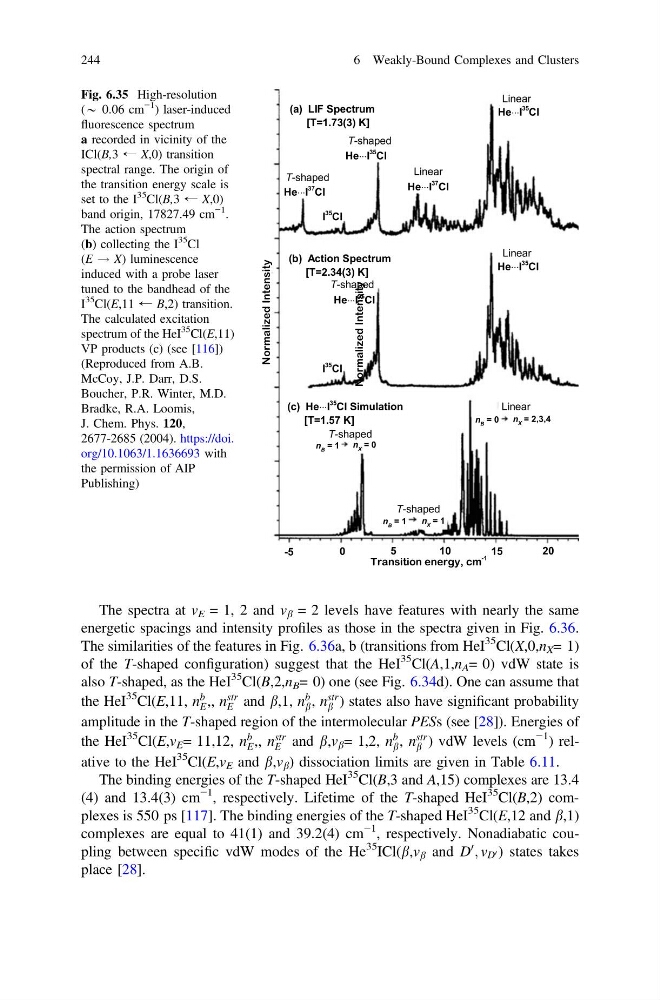
Fig. 6.35 High-resolution
(* 0.06 cm
−1
) laser-induced
fluorescence spectrum
a recorded in vicinity of the
ICl(B,3 ← X,0) transition
spectral range. The origin of
the transition energy scale is
set to the I
35
Cl(B,3 ← X,0)
band origin, 17827.49 cm
−1
.
The action spectrum
(b) collecting the I
35
Cl
(E ! X) luminescence
induced with a probe laser
tuned to the bandhead of the
I
35
Cl(E,11 ← B,2) transition.
The calculated excitation
spectrum of the HeI
35
Cl(E,11)
VP products (c) (see [116])
(Reproduced from A.B.
McCoy, J.P. Darr, D.S.
Boucher, P.R. Winter, M.D.
Bradke, R.A. Loomis,
J. Chem. Phys. 120,
2677-2685 (2004). https://doi.
org/10.1063/1.1636693 with
the permission of AIP
Publishing)
244
6 Weakly-Bound Complexes and Clusters
energetic spacings and intensity profiles as those in the spectra given in Fig. 6.36.
The similarities of the features in Fig. 6.36a, b (transitions from HeI
35 Cl(X,0,n X = 1)
of the T-shaped configuration) suggest that the HeI
35 Cl(A,1,n A = 0) vdW state is
also T-shaped, as the HeI
35 Cl(B,2,n B = 0) one (see Fig. 6.34d). One can assume that
the HeI
35
Cl(E,11, n
b
E ,, n
str
E and b,1, n
b
b , n
str
b ) states also have significant probability
amplitude in the T-shaped region of the intermolecular PESs (see [28]). Energies of
the HeI
35 Cl(E,v E = 11,12, n
b
E ,, n
str
E and b,v b = 1,2, n
b
b , n
str
b ) vdW levels (cm
−1 ) relative to the HeI
35 Cl(E,v E and b,v b ) dissociation limits are given in Table 6.11.
The binding energies of the T-shaped HeI
35 Cl(B,3 and A,15) complexes are 13.4
(4) and 13.4(3) cm
−1 , respectively. Lifetime of the T-shaped HeI
35 Cl(B,2) complexes is 550 ps [117]. The binding energies of the T-shaped HeI
35 Cl(E,12 and b,1)
complexes are equal to 41(1) and 39.2(4) cm
−1 , respectively. Nonadiabatic coupling between specific vdW modes of the He
35 ICl(b,v b and D
0
; v D 0 ) states takes
place [28].
Fig. 6.35 High-resolution
(* 0.06 cm
−1
) laser-induced
fluorescence spectrum
a recorded in vicinity of the
ICl(B,3 ← X,0) transition
spectral range. The origin of
the transition energy scale is
set to the I
35
Cl(B,3 ← X,0)
band origin, 17827.49 cm
−1
.
The action spectrum
(b) collecting the I
35
Cl
(E ! X) luminescence
induced with a probe laser
tuned to the bandhead of the
I
35
Cl(E,11 ← B,2) transition.
The calculated excitation
spectrum of the HeI
35
Cl(E,11)
VP products (c) (see [116])
(Reproduced from A.B.
McCoy, J.P. Darr, D.S.
Boucher, P.R. Winter, M.D.
Bradke, R.A. Loomis,
J. Chem. Phys. 120,
2677-2685 (2004). https://doi.
org/10.1063/1.1636693 with
the permission of AIP
Publishing)
244
6 Weakly-Bound Complexes and Clusters