

Very recently, spectroscopic characteristics, as well as VP and EP of the ArI 2 (E,
v E ,n E ) complexes were studied in wide v E = 0–16, range [106]. The T-shaped
ArI 2 (E,v E = 0–16,n E ) complexes were populated in two-step, two-color scheme
ArI 2 E; v E ¼ 0 À 16; n E
hm 2 B; v B ¼ 16 À 19; n B ¼ 0
hm 1 X; 0; n 1 ¼ 2
ð6:3:16Þ
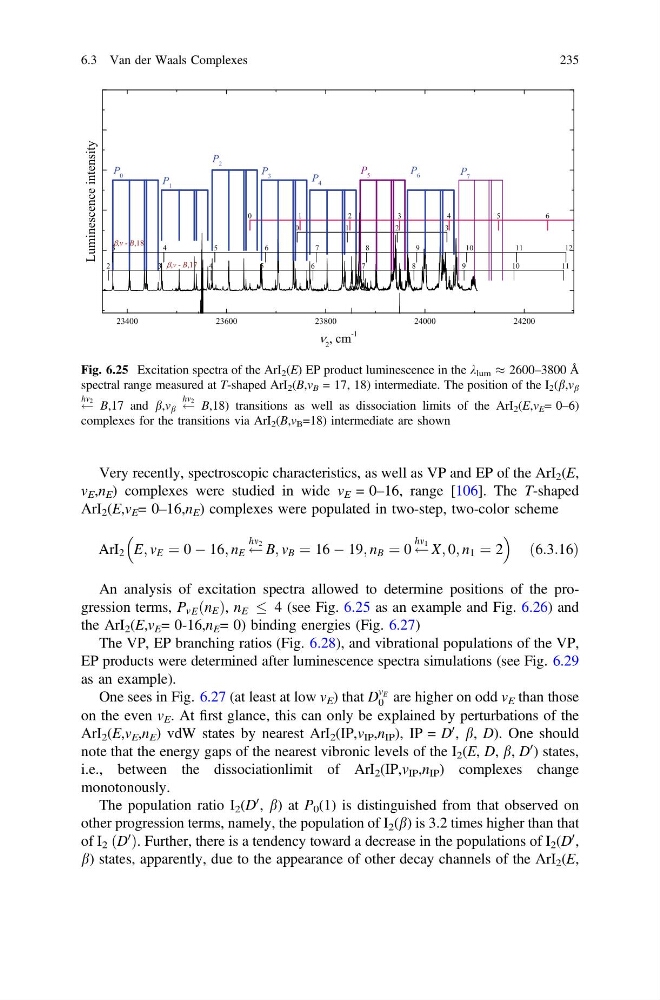
An analysis of excitation spectra allowed to determine positions of the progression terms, P vE n E
ð Þ, n E
4 (see Fig. 6.25 as an example and Fig. 6.26) and
the ArI 2 (E,v E = 0-16,n E = 0) binding energies (Fig. 6.27)
The VP, EP branching ratios (Fig. 6.28), and vibrational populations of the VP,
EP products were determined after luminescence spectra simulations (see Fig. 6.29
as an example).
One sees in Fig. 6.27 (at least at low v E ) that D
v E
0 are higher on odd v E than those
on the even v E . At first glance, this can only be explained by perturbations of the
ArI 2 (E,v E ,n E ) vdW states by nearest ArI 2 (IP,v IP ,n IP ), IP = D
0 , b, D). One should
note that the energy gaps of the nearest vibronic levels of the I 2 (E, D, b, D
0 ) states,
i.e., between the dissociationlimit of ArI 2 (IP,v IP ,n IP ) complexes change
monotonously.
The population ratio I 2 (D
0 , b) at P 0 (1) is distinguished from that observed on
other progression terms, namely, the population of I 2 (b) is 3.2 times higher than that
of I 2 ðD
0
Þ. Further, there is a tendency toward a decrease in the populations of I 2 (D
0 ,
b) states, apparently, due to the appearance of other decay channels of the ArI 2 (E,
Fig. 6.25 Excitation spectra of the ArI 2 (E) EP product luminescence in the k lum % 2600–3800 Å
spectral range measured at T-shaped ArI 2 (B,v B = 17, 18) intermediate. The position of the I 2 (b,v b
hm2 B,17 and b,v b
hm2 B,18) transitions as well as dissociation limits of the ArI 2 (E,v E = 0–6)
complexes for the transitions via ArI 2 (B,v B =18) intermediate are shown
6.3 Van der Waals Complexes
235
v E ,n E ) complexes were studied in wide v E = 0–16, range [106]. The T-shaped
ArI 2 (E,v E = 0–16,n E ) complexes were populated in two-step, two-color scheme
ArI 2 E; v E ¼ 0 À 16; n E
hm 2 B; v B ¼ 16 À 19; n B ¼ 0
hm 1 X; 0; n 1 ¼ 2
ð6:3:16Þ
An analysis of excitation spectra allowed to determine positions of the progression terms, P vE n E
ð Þ, n E
4 (see Fig. 6.25 as an example and Fig. 6.26) and
the ArI 2 (E,v E = 0-16,n E = 0) binding energies (Fig. 6.27)
The VP, EP branching ratios (Fig. 6.28), and vibrational populations of the VP,
EP products were determined after luminescence spectra simulations (see Fig. 6.29
as an example).
One sees in Fig. 6.27 (at least at low v E ) that D
v E
0 are higher on odd v E than those
on the even v E . At first glance, this can only be explained by perturbations of the
ArI 2 (E,v E ,n E ) vdW states by nearest ArI 2 (IP,v IP ,n IP ), IP = D
0 , b, D). One should
note that the energy gaps of the nearest vibronic levels of the I 2 (E, D, b, D
0 ) states,
i.e., between the dissociationlimit of ArI 2 (IP,v IP ,n IP ) complexes change
monotonously.
The population ratio I 2 (D
0 , b) at P 0 (1) is distinguished from that observed on
other progression terms, namely, the population of I 2 (b) is 3.2 times higher than that
of I 2 ðD
0
Þ. Further, there is a tendency toward a decrease in the populations of I 2 (D
0 ,
b) states, apparently, due to the appearance of other decay channels of the ArI 2 (E,
Fig. 6.25 Excitation spectra of the ArI 2 (E) EP product luminescence in the k lum % 2600–3800 Å
spectral range measured at T-shaped ArI 2 (B,v B = 17, 18) intermediate. The position of the I 2 (b,v b
hm2 B,17 and b,v b
hm2 B,18) transitions as well as dissociation limits of the ArI 2 (E,v E = 0–6)
complexes for the transitions via ArI 2 (B,v B =18) intermediate are shown
6.3 Van der Waals Complexes
235