

38
2 The Scientist’s Perspective on Brass Instrument Behaviour
2.1.3 Pressure Measured Inside a Brass Player’s Mouth
Figure 2.3c records that during the sounding of a trombone note the pressure in
front of the player’s lips was rising and falling with a peak-to-peak amplitude equal
to 10% of atmospheric pressure. What was happening behind the player’s lips at
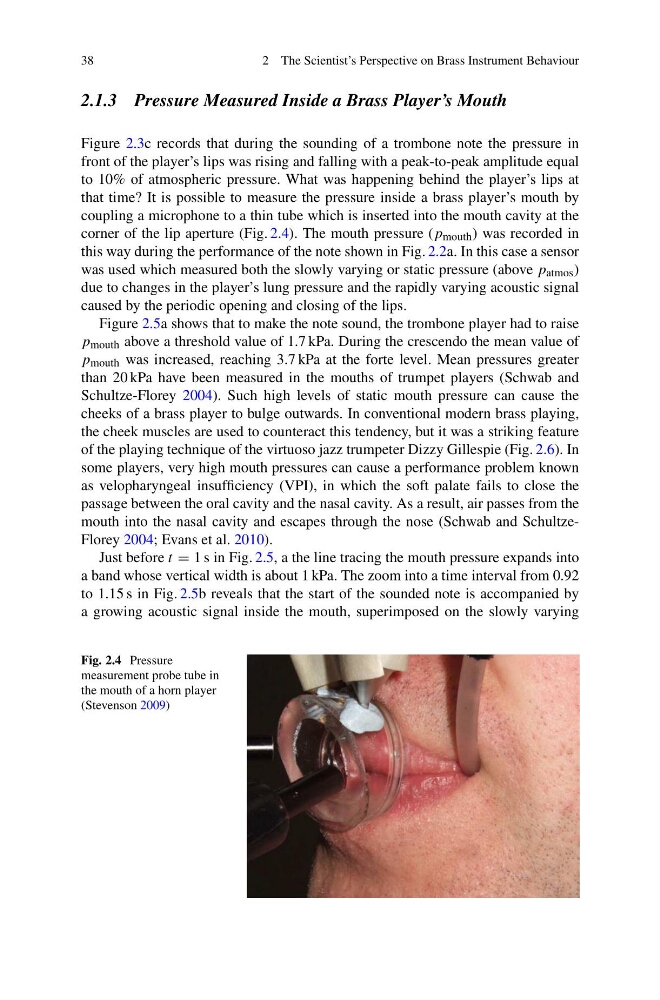
that time? It is possible to measure the pressure inside a brass player’s mouth by
coupling a microphone to a thin tube which is inserted into the mouth cavity at the
corner of the lip aperture (Fig. 2.4). The mouth pressure (p mouth ) was recorded in
this way during the performance of the note shown in Fig. 2.2a. In this case a sensor
was used which measured both the slowly varying or static pressure (above p atmos )
due to changes in the player’s lung pressure and the rapidly varying acoustic signal
caused by the periodic opening and closing of the lips.
Figure 2.5a shows that to make the note sound, the trombone player had to raise
p mouth above a threshold value of 1.7 kPa. During the crescendo the mean value of
p mouth was increased, reaching 3.7 kPa at the forte level. Mean pressures greater
than 20 kPa have been measured in the mouths of trumpet players (Schwab and
Schultze-Florey 2004). Such high levels of static mouth pressure can cause the
cheeks of a brass player to bulge outwards. In conventional modern brass playing,
the cheek muscles are used to counteract this tendency, but it was a striking feature
of the playing technique of the virtuoso jazz trumpeter Dizzy Gillespie (Fig. 2.6). In
some players, very high mouth pressures can cause a performance problem known
as velopharyngeal insufficiency (VPI), in which the soft palate fails to close the
passage between the oral cavity and the nasal cavity. As a result, air passes from the
mouth into the nasal cavity and escapes through the nose (Schwab and SchultzeFlorey 2004; Evans et al. 2010).
Just before t = 1 s in Fig. 2.5, a the line tracing the mouth pressure expands into
a band whose vertical width is about 1 kPa. The zoom into a time interval from 0.92
to 1.15 s in Fig. 2.5b reveals that the start of the sounded note is accompanied by
a growing acoustic signal inside the mouth, superimposed on the slowly varying
Fig. 2.4 Pressure
measurement probe tube in
the mouth of a horn player
(Stevenson 2009)
2 The Scientist’s Perspective on Brass Instrument Behaviour
2.1.3 Pressure Measured Inside a Brass Player’s Mouth
Figure 2.3c records that during the sounding of a trombone note the pressure in
front of the player’s lips was rising and falling with a peak-to-peak amplitude equal
to 10% of atmospheric pressure. What was happening behind the player’s lips at
that time? It is possible to measure the pressure inside a brass player’s mouth by
coupling a microphone to a thin tube which is inserted into the mouth cavity at the
corner of the lip aperture (Fig. 2.4). The mouth pressure (p mouth ) was recorded in
this way during the performance of the note shown in Fig. 2.2a. In this case a sensor
was used which measured both the slowly varying or static pressure (above p atmos )
due to changes in the player’s lung pressure and the rapidly varying acoustic signal
caused by the periodic opening and closing of the lips.
Figure 2.5a shows that to make the note sound, the trombone player had to raise
p mouth above a threshold value of 1.7 kPa. During the crescendo the mean value of
p mouth was increased, reaching 3.7 kPa at the forte level. Mean pressures greater
than 20 kPa have been measured in the mouths of trumpet players (Schwab and
Schultze-Florey 2004). Such high levels of static mouth pressure can cause the
cheeks of a brass player to bulge outwards. In conventional modern brass playing,
the cheek muscles are used to counteract this tendency, but it was a striking feature
of the playing technique of the virtuoso jazz trumpeter Dizzy Gillespie (Fig. 2.6). In
some players, very high mouth pressures can cause a performance problem known
as velopharyngeal insufficiency (VPI), in which the soft palate fails to close the
passage between the oral cavity and the nasal cavity. As a result, air passes from the
mouth into the nasal cavity and escapes through the nose (Schwab and SchultzeFlorey 2004; Evans et al. 2010).
Just before t = 1 s in Fig. 2.5, a the line tracing the mouth pressure expands into
a band whose vertical width is about 1 kPa. The zoom into a time interval from 0.92
to 1.15 s in Fig. 2.5b reveals that the start of the sounded note is accompanied by
a growing acoustic signal inside the mouth, superimposed on the slowly varying
Fig. 2.4 Pressure
measurement probe tube in
the mouth of a horn player
(Stevenson 2009)