

6.7 Going Further: Analytical Modelling of Vibroacoustic Coupling in Ducts
331
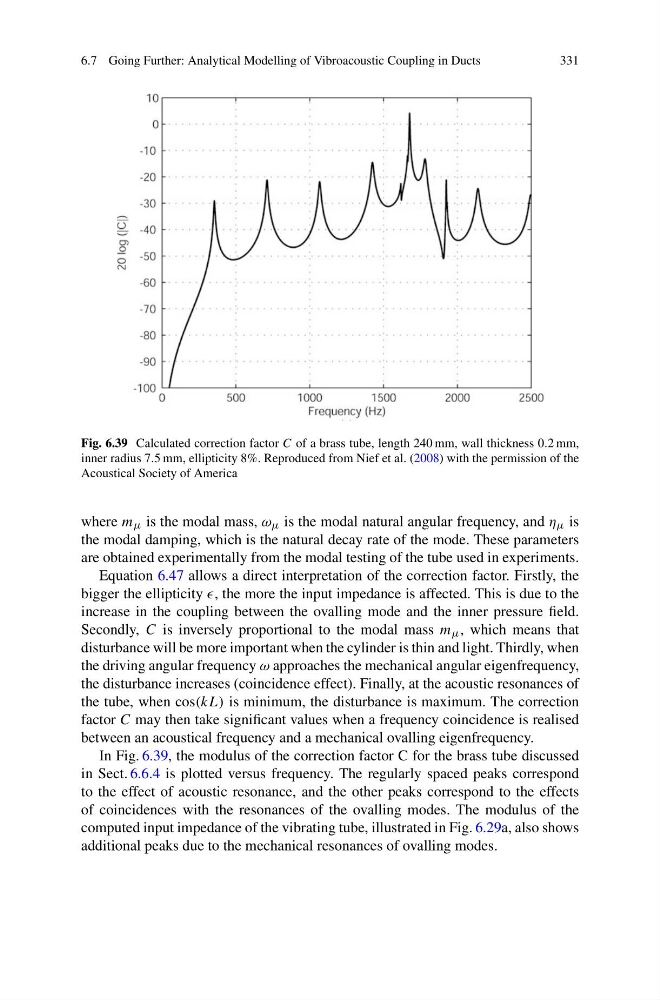
Fig. 6.39 Calculated correction factor C of a brass tube, length 240 mm, wall thickness 0.2 mm,
inner radius 7.5 mm, ellipticity 8%. Reproduced from Nief et al. (2008) with the permission of the
Acoustical Society of America
where m μ is the modal mass, ω μ is the modal natural angular frequency, and η μ is
the modal damping, which is the natural decay rate of the mode. These parameters
are obtained experimentally from the modal testing of the tube used in experiments.
Equation 6.47 allows a direct interpretation of the correction factor. Firstly, the
bigger the ellipticity , the more the input impedance is affected. This is due to the
increase in the coupling between the ovalling mode and the inner pressure field.
Secondly, C is inversely proportional to the modal mass m μ , which means that
disturbance will be more important when the cylinder is thin and light. Thirdly, when
the driving angular frequency ω approaches the mechanical angular eigenfrequency,
the disturbance increases (coincidence effect). Finally, at the acoustic resonances of
the tube, when cos(kL) is minimum, the disturbance is maximum. The correction
factor C may then take significant values when a frequency coincidence is realised
between an acoustical frequency and a mechanical ovalling eigenfrequency.
In Fig. 6.39, the modulus of the correction factor C for the brass tube discussed
in Sect. 6.6.4 is plotted versus frequency. The regularly spaced peaks correspond
to the effect of acoustic resonance, and the other peaks correspond to the effects
of coincidences with the resonances of the ovalling modes. The modulus of the
computed input impedance of the vibrating tube, illustrated in Fig. 6.29a, also shows
additional peaks due to the mechanical resonances of ovalling modes.
331
Fig. 6.39 Calculated correction factor C of a brass tube, length 240 mm, wall thickness 0.2 mm,
inner radius 7.5 mm, ellipticity 8%. Reproduced from Nief et al. (2008) with the permission of the
Acoustical Society of America
where m μ is the modal mass, ω μ is the modal natural angular frequency, and η μ is
the modal damping, which is the natural decay rate of the mode. These parameters
are obtained experimentally from the modal testing of the tube used in experiments.
Equation 6.47 allows a direct interpretation of the correction factor. Firstly, the
bigger the ellipticity , the more the input impedance is affected. This is due to the
increase in the coupling between the ovalling mode and the inner pressure field.
Secondly, C is inversely proportional to the modal mass m μ , which means that
disturbance will be more important when the cylinder is thin and light. Thirdly, when
the driving angular frequency ω approaches the mechanical angular eigenfrequency,
the disturbance increases (coincidence effect). Finally, at the acoustic resonances of
the tube, when cos(kL) is minimum, the disturbance is maximum. The correction
factor C may then take significant values when a frequency coincidence is realised
between an acoustical frequency and a mechanical ovalling eigenfrequency.
In Fig. 6.39, the modulus of the correction factor C for the brass tube discussed
in Sect. 6.6.4 is plotted versus frequency. The regularly spaced peaks correspond
to the effect of acoustic resonance, and the other peaks correspond to the effects
of coincidences with the resonances of the ovalling modes. The modulus of the
computed input impedance of the vibrating tube, illustrated in Fig. 6.29a, also shows
additional peaks due to the mechanical resonances of ovalling modes.