

310
6 Shocks and Surprises: Refining the Elementary Model
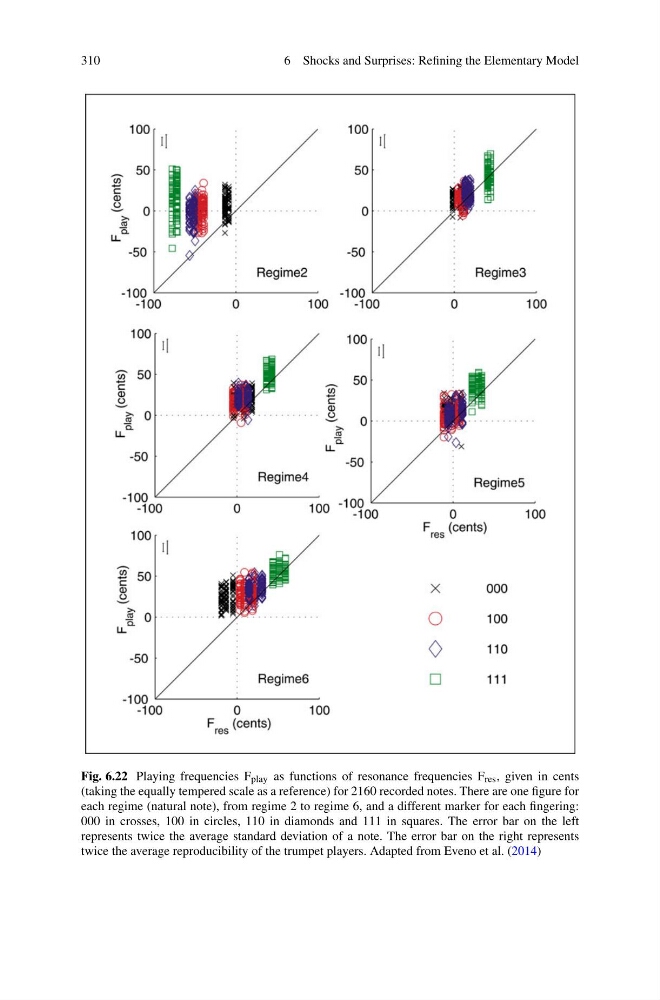
Fig. 6.22 Playing frequencies F play as functions of resonance frequencies F res , given in cents
(taking the equally tempered scale as a reference) for 2160 recorded notes. There are one figure for
each regime (natural note), from regime 2 to regime 6, and a different marker for each fingering:
000 in crosses, 100 in circles, 110 in diamonds and 111 in squares. The error bar on the left
represents twice the average standard deviation of a note. The error bar on the right represents
twice the average reproducibility of the trumpet players. Adapted from Eveno et al. (2014)
6 Shocks and Surprises: Refining the Elementary Model
Fig. 6.22 Playing frequencies F play as functions of resonance frequencies F res , given in cents
(taking the equally tempered scale as a reference) for 2160 recorded notes. There are one figure for
each regime (natural note), from regime 2 to regime 6, and a different marker for each fingering:
000 in crosses, 100 in circles, 110 in diamonds and 111 in squares. The error bar on the left
represents twice the average standard deviation of a note. The error bar on the right represents
twice the average reproducibility of the trumpet players. Adapted from Eveno et al. (2014)