

5.4 Going Further: From Linear Stability Analysis to Oscillation Regimes
261
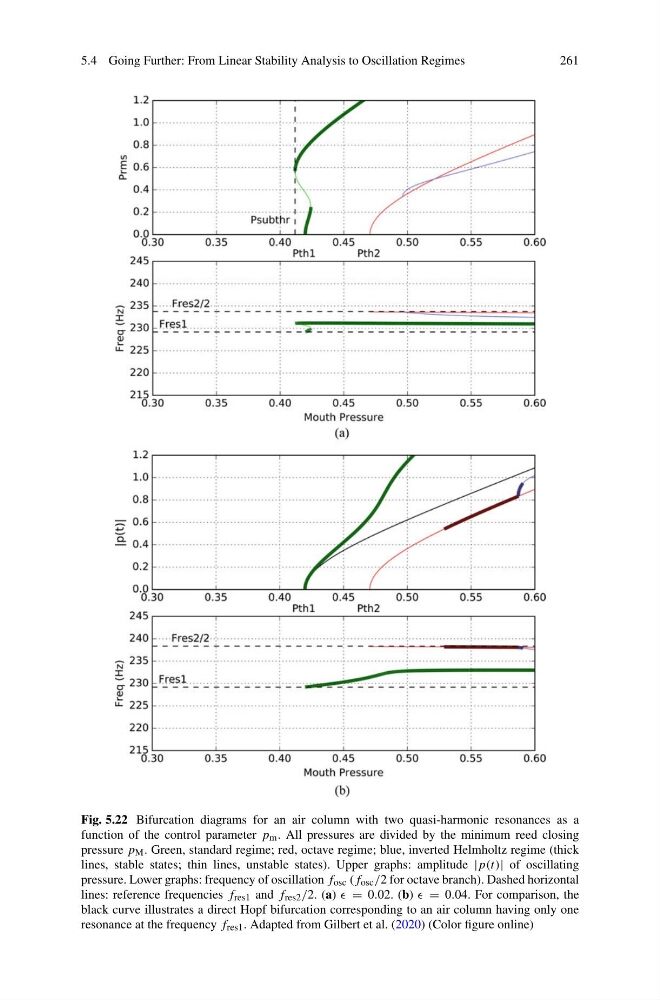
Fig. 5.22 Bifurcation diagrams for an air column with two quasi-harmonic resonances as a
function of the control parameter p m . All pressures are divided by the minimum reed closing
pressure p M . Green, standard regime; red, octave regime; blue, inverted Helmholtz regime (thick
lines, stable states; thin lines, unstable states). Upper graphs: amplitude |p(t)| of oscillating
pressure. Lower graphs: frequency of oscillation f osc (f osc /2 for octave branch). Dashed horizontal
lines: reference frequencies f res1 and f res2 /2. (a) = 0.02. (b) = 0.04. For comparison, the
black curve illustrates a direct Hopf bifurcation corresponding to an air column having only one
resonance at the frequency f res1 . Adapted from Gilbert et al. (2020) (Color figure online)
261
Fig. 5.22 Bifurcation diagrams for an air column with two quasi-harmonic resonances as a
function of the control parameter p m . All pressures are divided by the minimum reed closing
pressure p M . Green, standard regime; red, octave regime; blue, inverted Helmholtz regime (thick
lines, stable states; thin lines, unstable states). Upper graphs: amplitude |p(t)| of oscillating
pressure. Lower graphs: frequency of oscillation f osc (f osc /2 for octave branch). Dashed horizontal
lines: reference frequencies f res1 and f res2 /2. (a) = 0.02. (b) = 0.04. For comparison, the
black curve illustrates a direct Hopf bifurcation corresponding to an air column having only one
resonance at the frequency f res1 . Adapted from Gilbert et al. (2020) (Color figure online)