

5.4 Going Further: From Linear Stability Analysis to Oscillation Regimes
253
f thr =
Imλ
2π
.
(5.42)
Although by its nature linear stability analysis can only yield information about
the behaviour of oscillating states for mouth pressures very near p thr , its application
to the elementary model offers valuable insights into several aspects of realistic
brass playing. A good example is provided by a study of trombone playing using
LSA by Velut et al. (2017a). The elementary model was expressed in the statespace formalism described in Sect. 5.4.2, with the input impedance represented as
a sum of complex modes. The study was carried out for a range of lip frequencies
f l ∈ [20 : 500] Hz. For each value of f l , the eigenvalues of the Jacobian matrix
were computed for increasing values of p m until the first instability occurred.
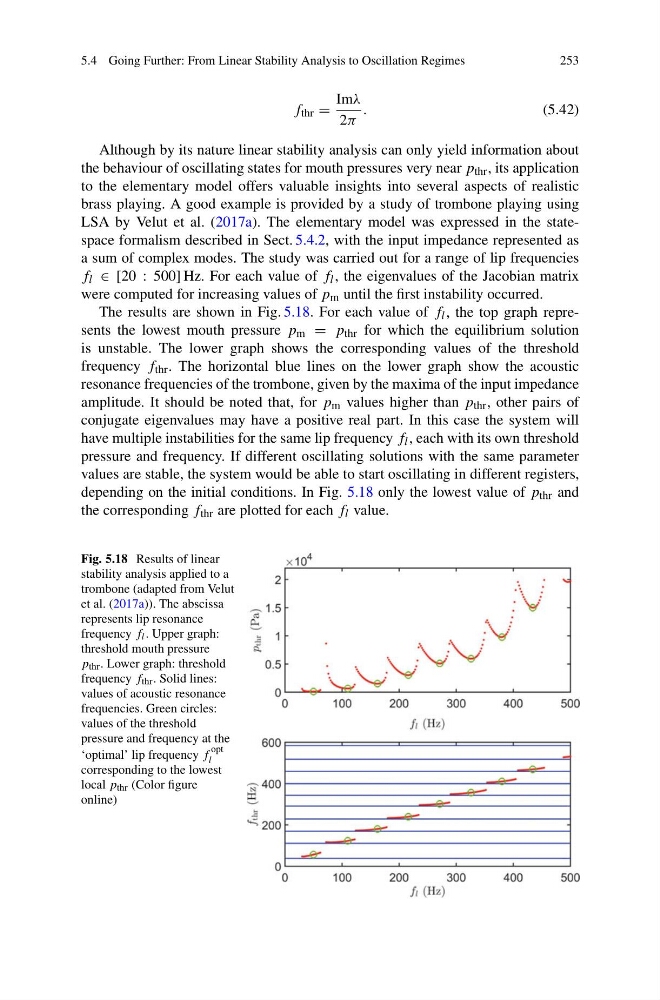
The results are shown in Fig. 5.18. For each value of f l , the top graph represents the lowest mouth pressure p m = p thr for which the equilibrium solution
is unstable. The lower graph shows the corresponding values of the threshold
frequency f thr . The horizontal blue lines on the lower graph show the acoustic
resonance frequencies of the trombone, given by the maxima of the input impedance
amplitude. It should be noted that, for p m values higher than p thr , other pairs of
conjugate eigenvalues may have a positive real part. In this case the system will
have multiple instabilities for the same lip frequency f l , each with its own threshold
pressure and frequency. If different oscillating solutions with the same parameter
values are stable, the system would be able to start oscillating in different registers,
depending on the initial conditions. In Fig. 5.18 only the lowest value of p thr and
the corresponding f thr are plotted for each f l value.
Fig. 5.18 Results of linear
stability analysis applied to a
trombone (adapted from Velut
et al. (2017a)). The abscissa
represents lip resonance
frequency f l . Upper graph:
threshold mouth pressure
p thr . Lower graph: threshold
frequency f thr . Solid lines:
values of acoustic resonance
frequencies. Green circles:
values of the threshold
pressure and frequency at the
‘optimal’ lip frequency f
opt
l
corresponding to the lowest
local p thr (Color figure
online)
253
f thr =
Imλ
2π
.
(5.42)
Although by its nature linear stability analysis can only yield information about
the behaviour of oscillating states for mouth pressures very near p thr , its application
to the elementary model offers valuable insights into several aspects of realistic
brass playing. A good example is provided by a study of trombone playing using
LSA by Velut et al. (2017a). The elementary model was expressed in the statespace formalism described in Sect. 5.4.2, with the input impedance represented as
a sum of complex modes. The study was carried out for a range of lip frequencies
f l ∈ [20 : 500] Hz. For each value of f l , the eigenvalues of the Jacobian matrix
were computed for increasing values of p m until the first instability occurred.
The results are shown in Fig. 5.18. For each value of f l , the top graph represents the lowest mouth pressure p m = p thr for which the equilibrium solution
is unstable. The lower graph shows the corresponding values of the threshold
frequency f thr . The horizontal blue lines on the lower graph show the acoustic
resonance frequencies of the trombone, given by the maxima of the input impedance
amplitude. It should be noted that, for p m values higher than p thr , other pairs of
conjugate eigenvalues may have a positive real part. In this case the system will
have multiple instabilities for the same lip frequency f l , each with its own threshold
pressure and frequency. If different oscillating solutions with the same parameter
values are stable, the system would be able to start oscillating in different registers,
depending on the initial conditions. In Fig. 5.18 only the lowest value of p thr and
the corresponding f thr are plotted for each f l value.
Fig. 5.18 Results of linear
stability analysis applied to a
trombone (adapted from Velut
et al. (2017a)). The abscissa
represents lip resonance
frequency f l . Upper graph:
threshold mouth pressure
p thr . Lower graph: threshold
frequency f thr . Solid lines:
values of acoustic resonance
frequencies. Green circles:
values of the threshold
pressure and frequency at the
‘optimal’ lip frequency f
opt
l
corresponding to the lowest
local p thr (Color figure
online)