

216
4 After the Lips: Acoustic Resonances and Radiation
Sun function (dB)
40
30
20
10
0
-10 100
200
300
400
500
600
700
800
Frequency (Hz)
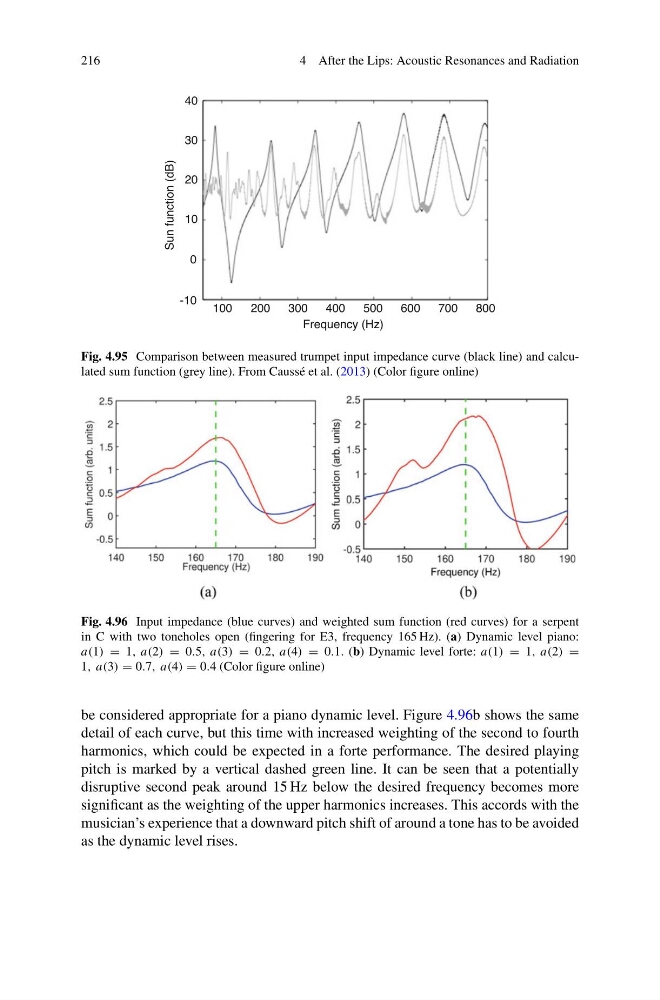
Fig. 4.95 Comparison between measured trumpet input impedance curve (black line) and calculated sum function (grey line). From Caussé et al. (2013) (Color figure online)
Fig. 4.96 Input impedance (blue curves) and weighted sum function (red curves) for a serpent
in C with two toneholes open (fingering for E3, frequency 165 Hz). (a) Dynamic level piano:
a(1) = 1, a(2) = 0.5, a(3) = 0.2, a(4) = 0.1. (b) Dynamic level forte: a(1) = 1, a(2) =
1, a(3) = 0.7, a(4) = 0.4 (Color figure online)
be considered appropriate for a piano dynamic level. Figure 4.96b shows the same
detail of each curve, but this time with increased weighting of the second to fourth
harmonics, which could be expected in a forte performance. The desired playing
pitch is marked by a vertical dashed green line. It can be seen that a potentially
disruptive second peak around 15 Hz below the desired frequency becomes more
significant as the weighting of the upper harmonics increases. This accords with the
musician’s experience that a downward pitch shift of around a tone has to be avoided
as the dynamic level rises.
4 After the Lips: Acoustic Resonances and Radiation
Sun function (dB)
40
30
20
10
0
-10 100
200
300
400
500
600
700
800
Frequency (Hz)
Fig. 4.95 Comparison between measured trumpet input impedance curve (black line) and calculated sum function (grey line). From Caussé et al. (2013) (Color figure online)
Fig. 4.96 Input impedance (blue curves) and weighted sum function (red curves) for a serpent
in C with two toneholes open (fingering for E3, frequency 165 Hz). (a) Dynamic level piano:
a(1) = 1, a(2) = 0.5, a(3) = 0.2, a(4) = 0.1. (b) Dynamic level forte: a(1) = 1, a(2) =
1, a(3) = 0.7, a(4) = 0.4 (Color figure online)
be considered appropriate for a piano dynamic level. Figure 4.96b shows the same
detail of each curve, but this time with increased weighting of the second to fourth
harmonics, which could be expected in a forte performance. The desired playing
pitch is marked by a vertical dashed green line. It can be seen that a potentially
disruptive second peak around 15 Hz below the desired frequency becomes more
significant as the weighting of the upper harmonics increases. This accords with the
musician’s experience that a downward pitch shift of around a tone has to be avoided
as the dynamic level rises.