

188
4 After the Lips: Acoustic Resonances and Radiation
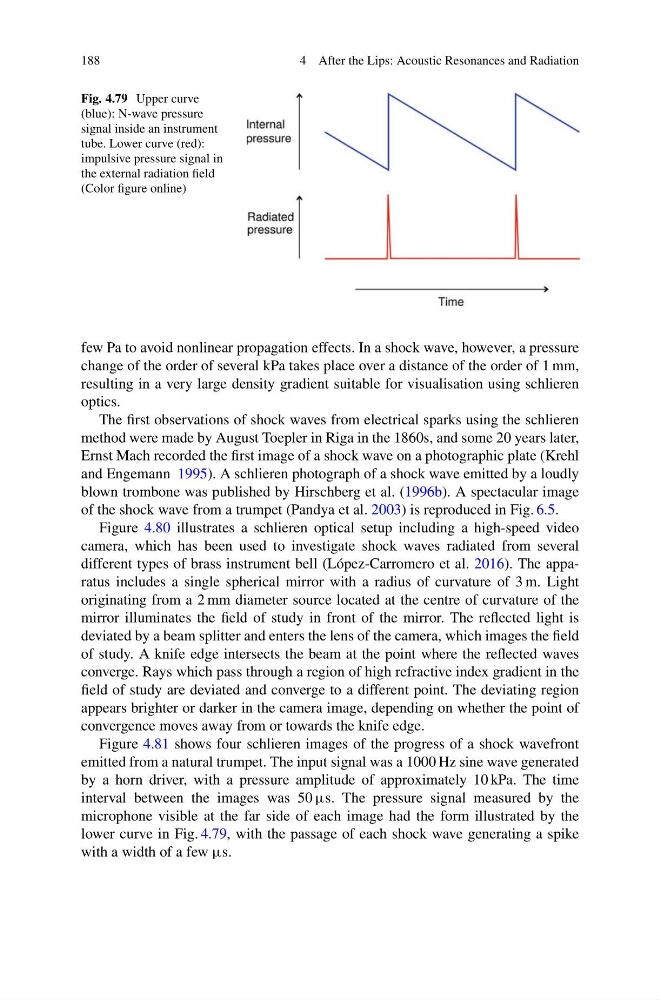
Fig. 4.79 Upper curve
(blue): N-wave pressure
signal inside an instrument
tube. Lower curve (red):
impulsive pressure signal in
the external radiation field
(Color figure online)
few Pa to avoid nonlinear propagation effects. In a shock wave, however, a pressure
change of the order of several kPa takes place over a distance of the order of 1 mm,
resulting in a very large density gradient suitable for visualisation using schlieren
optics.
The first observations of shock waves from electrical sparks using the schlieren
method were made by August Toepler in Riga in the 1860s, and some 20 years later,
Ernst Mach recorded the first image of a shock wave on a photographic plate (Krehl
and Engemann 1995). A schlieren photograph of a shock wave emitted by a loudly
blown trombone was published by Hirschberg et al. (1996b). A spectacular image
of the shock wave from a trumpet (Pandya et al. 2003) is reproduced in Fig. 6.5.
Figure 4.80 illustrates a schlieren optical setup including a high-speed video
camera, which has been used to investigate shock waves radiated from several
different types of brass instrument bell (López-Carromero et al. 2016). The apparatus includes a single spherical mirror with a radius of curvature of 3 m. Light
originating from a 2 mm diameter source located at the centre of curvature of the
mirror illuminates the field of study in front of the mirror. The reflected light is
deviated by a beam splitter and enters the lens of the camera, which images the field
of study. A knife edge intersects the beam at the point where the reflected waves
converge. Rays which pass through a region of high refractive index gradient in the
field of study are deviated and converge to a different point. The deviating region
appears brighter or darker in the camera image, depending on whether the point of
convergence moves away from or towards the knife edge.
Figure 4.81 shows four schlieren images of the progress of a shock wavefront
emitted from a natural trumpet. The input signal was a 1000 Hz sine wave generated
by a horn driver, with a pressure amplitude of approximately 10 kPa. The time
interval between the images was 50 μs. The pressure signal measured by the
microphone visible at the far side of each image had the form illustrated by the
lower curve in Fig. 4.79, with the passage of each shock wave generating a spike
with a width of a few μs.
4 After the Lips: Acoustic Resonances and Radiation
Fig. 4.79 Upper curve
(blue): N-wave pressure
signal inside an instrument
tube. Lower curve (red):
impulsive pressure signal in
the external radiation field
(Color figure online)
few Pa to avoid nonlinear propagation effects. In a shock wave, however, a pressure
change of the order of several kPa takes place over a distance of the order of 1 mm,
resulting in a very large density gradient suitable for visualisation using schlieren
optics.
The first observations of shock waves from electrical sparks using the schlieren
method were made by August Toepler in Riga in the 1860s, and some 20 years later,
Ernst Mach recorded the first image of a shock wave on a photographic plate (Krehl
and Engemann 1995). A schlieren photograph of a shock wave emitted by a loudly
blown trombone was published by Hirschberg et al. (1996b). A spectacular image
of the shock wave from a trumpet (Pandya et al. 2003) is reproduced in Fig. 6.5.
Figure 4.80 illustrates a schlieren optical setup including a high-speed video
camera, which has been used to investigate shock waves radiated from several
different types of brass instrument bell (López-Carromero et al. 2016). The apparatus includes a single spherical mirror with a radius of curvature of 3 m. Light
originating from a 2 mm diameter source located at the centre of curvature of the
mirror illuminates the field of study in front of the mirror. The reflected light is
deviated by a beam splitter and enters the lens of the camera, which images the field
of study. A knife edge intersects the beam at the point where the reflected waves
converge. Rays which pass through a region of high refractive index gradient in the
field of study are deviated and converge to a different point. The deviating region
appears brighter or darker in the camera image, depending on whether the point of
convergence moves away from or towards the knife edge.
Figure 4.81 shows four schlieren images of the progress of a shock wavefront
emitted from a natural trumpet. The input signal was a 1000 Hz sine wave generated
by a horn driver, with a pressure amplitude of approximately 10 kPa. The time
interval between the images was 50 μs. The pressure signal measured by the
microphone visible at the far side of each image had the form illustrated by the
lower curve in Fig. 4.79, with the passage of each shock wave generating a spike
with a width of a few μs.