

7 Role of Mass Asymmetry on the Energy of Peak …
87
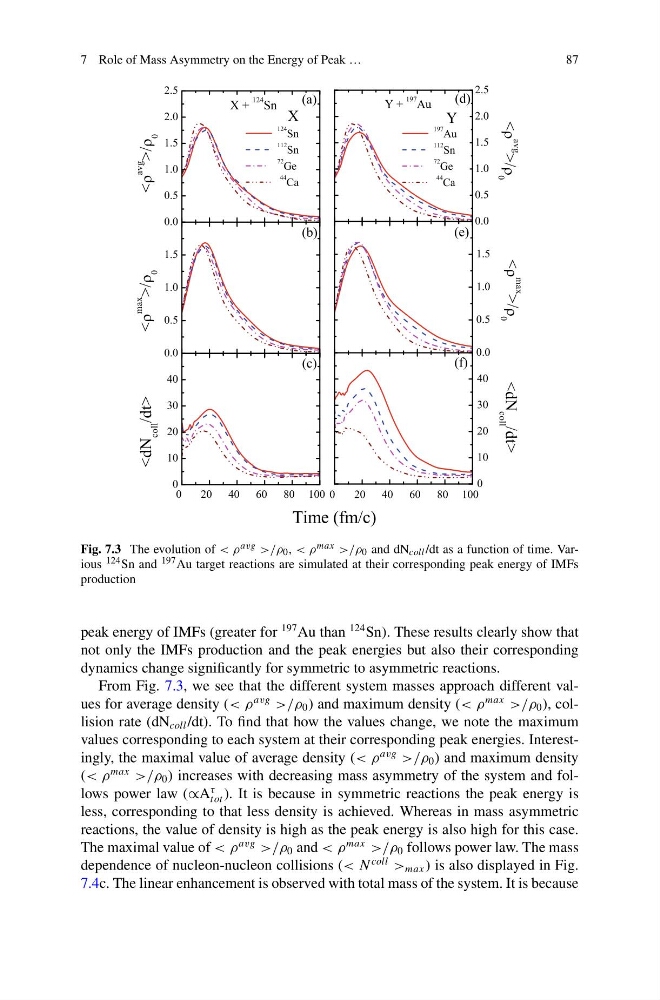
Fig. 7.3 The evolution of < ρ avg >/ρ 0 , < ρ max >/ρ 0 and dN coll /dt as a function of time. Various 124 Sn and 197 Au target reactions are simulated at their corresponding peak energy of IMFs
production
peak energy of IMFs (greater for
197 Au than
124 Sn). These results clearly show that
not only the IMFs production and the peak energies but also their corresponding
dynamics change significantly for symmetric to asymmetric reactions.
From Fig. 7.3, we see that the different system masses approach different values for average density (< ρ
avg
>/ρ 0 ) and maximum density (< ρ
max
>/ρ 0 ), collision rate (dN coll /dt). To find that how the values change, we note the maximum
values corresponding to each system at their corresponding peak energies. Interestingly, the maximal value of average density (< ρ
avg
>/ρ 0 ) and maximum density
(< ρ
max
>/ρ 0 ) increases with decreasing mass asymmetry of the system and follows power law (∝A
τ
tot ). It is because in symmetric reactions the peak energy is
less, corresponding to that less density is achieved. Whereas in mass asymmetric
reactions, the value of density is high as the peak energy is also high for this case.
The maximal value of < ρ
avg
>/ρ 0 and < ρ
max
>/ρ 0 follows power law. The mass
dependence of nucleon-nucleon collisions (< N
coll
> max ) is also displayed in Fig.
7.4c. The linear enhancement is observed with total mass of the system. It is because
87
Fig. 7.3 The evolution of < ρ avg >/ρ 0 , < ρ max >/ρ 0 and dN coll /dt as a function of time. Various 124 Sn and 197 Au target reactions are simulated at their corresponding peak energy of IMFs
production
peak energy of IMFs (greater for
197 Au than
124 Sn). These results clearly show that
not only the IMFs production and the peak energies but also their corresponding
dynamics change significantly for symmetric to asymmetric reactions.
From Fig. 7.3, we see that the different system masses approach different values for average density (< ρ
avg
>/ρ 0 ) and maximum density (< ρ
max
>/ρ 0 ), collision rate (dN coll /dt). To find that how the values change, we note the maximum
values corresponding to each system at their corresponding peak energies. Interestingly, the maximal value of average density (< ρ
avg
>/ρ 0 ) and maximum density
(< ρ
max
>/ρ 0 ) increases with decreasing mass asymmetry of the system and follows power law (∝A
τ
tot ). It is because in symmetric reactions the peak energy is
less, corresponding to that less density is achieved. Whereas in mass asymmetric
reactions, the value of density is high as the peak energy is also high for this case.
The maximal value of < ρ
avg
>/ρ 0 and < ρ
max
>/ρ 0 follows power law. The mass
dependence of nucleon-nucleon collisions (< N
coll
> max ) is also displayed in Fig.
7.4c. The linear enhancement is observed with total mass of the system. It is because