

46
consumption by a quarter in 2030. Then, if the remaining quarter of the energy can
be covered by power generation by solar cells, etc., the energy brought in from the
outside would be zero. If the amount of electricity generated exceeds consumption,
it is also possible to sell energy.
If we list energy saving measures such as these, some people say, “Energy conservation cannot be done because it costs money.” However, it does not mean that
we have to do everything right now.
Even if you use electric appliances such as air conditioners and refrigerators
quite normally, they will be replaced every 10 years. It is impossible that newly
purchased products are less energy efficient than the models 10 years ago. Low
carbonization is possible by simply replacing the older models.
Energy efficiency is also improved in recent models of Enefarm and EcoCute.
Besides, as the prices have dropped considerably since their launch, it should be
easy to recognize the cost benefits of introduction. Insulation materials and doubleglazing windows are somewhat difficult to incorporate into existing houses, and the
costs are relatively high. However, the energy saving effect of heat insulation is
great. In case of new construction or large-scale renovation, installation should be
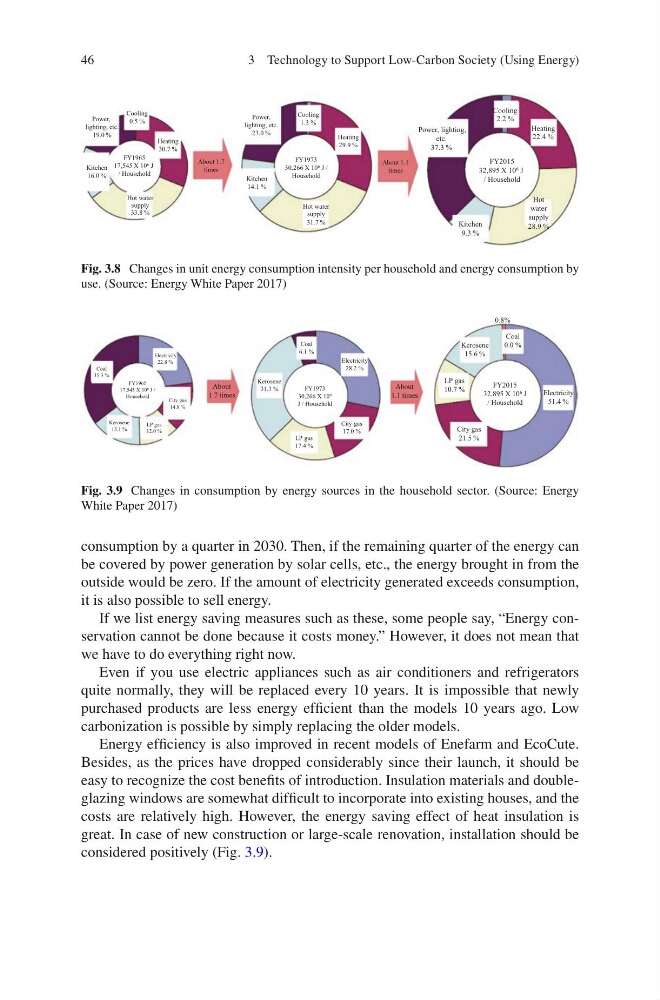
considered positively (Fig. 3.9).
Power,
lighting, etc.
19.0 %
Cooling
0.5 %
Heating
30.7 %
Hot water
supply
33.8 %
Kitchen
16.0 %
FY1965
17,545 X 10 6 J
/ Household
About 1.7
times
Power,
lighting, etc.
23.0 %
Cooling
1.3 %
Heating
29.9 %
Hot water
supply
31.7 %
Kitchen
14.1 %
FY1973
30,266 X 10 6 J /
Household
About 1.1
times
Power, lighting,
etc.
37.3 %
Cooling
2.2 %
Heating
22.4 %
Hot
water
supply
28.9 %
Kitchen
9.3 %
FY2015
32,895 X 10 6 J
/ Household
Fig. 3.8 Changes in unit energy consumption intensity per household and energy consumption by
use. (Source: Energy White Paper 2017)
City gas
14.8 %
Coal
35.3 %
Electricity
22.8 %
LP gas
12.0 %
Kerosene
15.1 %
FY1965
17,545 X 10 6 J /
Household
About
1.7 times
About
1.1 times
City gas
17.0 %
Coal
6.1 %
Electricity
28.2 %
LP gas
17.4 %
Kerosene
31.3 %
FY1973
30,266 X 10 6
J / Household
City gas
21.5 %
Coal
0.0 %
Electricity
51.4 %
LP gas
10.7 %
Kerosene
15.6 %
FY2015
32,895 X 10 6 J
/ Household
0.8%
Fig. 3.9 Changes in consumption by energy sources in the household sector. (Source: Energy
White Paper 2017)
3 Technology to Support Low-Carbon Society (Using Energy)
consumption by a quarter in 2030. Then, if the remaining quarter of the energy can
be covered by power generation by solar cells, etc., the energy brought in from the
outside would be zero. If the amount of electricity generated exceeds consumption,
it is also possible to sell energy.
If we list energy saving measures such as these, some people say, “Energy conservation cannot be done because it costs money.” However, it does not mean that
we have to do everything right now.
Even if you use electric appliances such as air conditioners and refrigerators
quite normally, they will be replaced every 10 years. It is impossible that newly
purchased products are less energy efficient than the models 10 years ago. Low
carbonization is possible by simply replacing the older models.
Energy efficiency is also improved in recent models of Enefarm and EcoCute.
Besides, as the prices have dropped considerably since their launch, it should be
easy to recognize the cost benefits of introduction. Insulation materials and doubleglazing windows are somewhat difficult to incorporate into existing houses, and the
costs are relatively high. However, the energy saving effect of heat insulation is
great. In case of new construction or large-scale renovation, installation should be
considered positively (Fig. 3.9).
Power,
lighting, etc.
19.0 %
Cooling
0.5 %
Heating
30.7 %
Hot water
supply
33.8 %
Kitchen
16.0 %
FY1965
17,545 X 10 6 J
/ Household
About 1.7
times
Power,
lighting, etc.
23.0 %
Cooling
1.3 %
Heating
29.9 %
Hot water
supply
31.7 %
Kitchen
14.1 %
FY1973
30,266 X 10 6 J /
Household
About 1.1
times
Power, lighting,
etc.
37.3 %
Cooling
2.2 %
Heating
22.4 %
Hot
water
supply
28.9 %
Kitchen
9.3 %
FY2015
32,895 X 10 6 J
/ Household
Fig. 3.8 Changes in unit energy consumption intensity per household and energy consumption by
use. (Source: Energy White Paper 2017)
City gas
14.8 %
Coal
35.3 %
Electricity
22.8 %
LP gas
12.0 %
Kerosene
15.1 %
FY1965
17,545 X 10 6 J /
Household
About
1.7 times
About
1.1 times
City gas
17.0 %
Coal
6.1 %
Electricity
28.2 %
LP gas
17.4 %
Kerosene
31.3 %
FY1973
30,266 X 10 6
J / Household
City gas
21.5 %
Coal
0.0 %
Electricity
51.4 %
LP gas
10.7 %
Kerosene
15.6 %
FY2015
32,895 X 10 6 J
/ Household
0.8%
Fig. 3.9 Changes in consumption by energy sources in the household sector. (Source: Energy
White Paper 2017)
3 Technology to Support Low-Carbon Society (Using Energy)