

24
shrink and service industries expand, energy consumption relative to GDP falls off
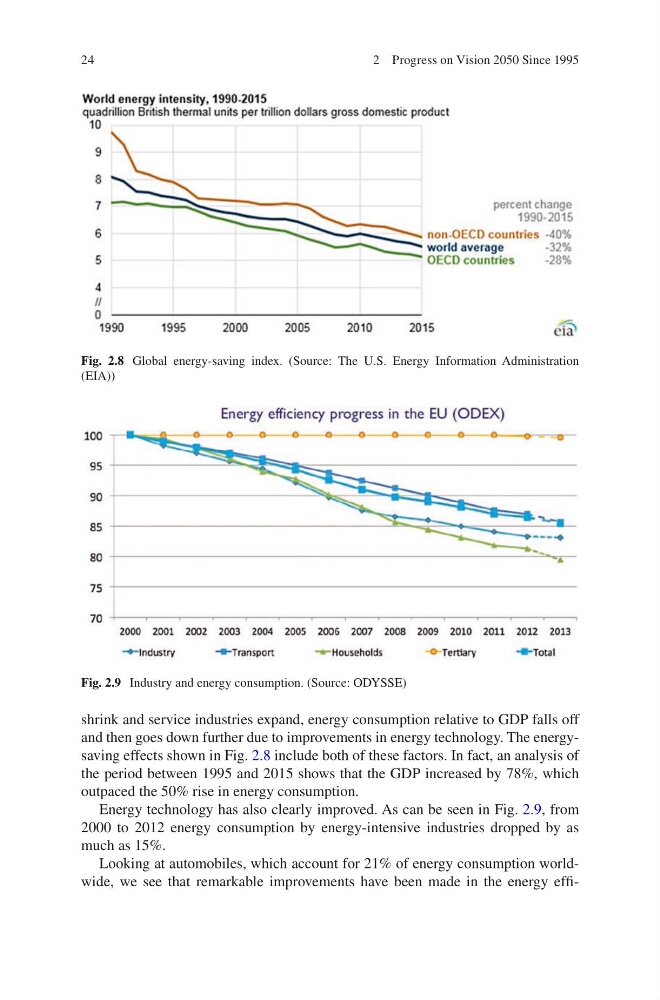
and then goes down further due to improvements in energy technology. The energysaving effects shown in Fig. 2.8 include both of these factors. In fact, an analysis of
the period between 1995 and 2015 shows that the GDP increased by 78%, which
outpaced the 50% rise in energy consumption.
Energy technology has also clearly improved. As can be seen in Fig. 2.9, from
2000 to 2012 energy consumption by energy-intensive industries dropped by as
much as 15%.
Looking at automobiles, which account for 21% of energy consumption worldwide, we see that remarkable improvements have been made in the energy effiFig. 2.8 Global energy-saving index. (Source: The U.S. Energy Information Administration
(EIA))
Fig. 2.9 Industry and energy consumption. (Source: ODYSSE)
2 Progress on Vision 2050 Since 1995
shrink and service industries expand, energy consumption relative to GDP falls off
and then goes down further due to improvements in energy technology. The energysaving effects shown in Fig. 2.8 include both of these factors. In fact, an analysis of
the period between 1995 and 2015 shows that the GDP increased by 78%, which
outpaced the 50% rise in energy consumption.
Energy technology has also clearly improved. As can be seen in Fig. 2.9, from
2000 to 2012 energy consumption by energy-intensive industries dropped by as
much as 15%.
Looking at automobiles, which account for 21% of energy consumption worldwide, we see that remarkable improvements have been made in the energy effiFig. 2.8 Global energy-saving index. (Source: The U.S. Energy Information Administration
(EIA))
Fig. 2.9 Industry and energy consumption. (Source: ODYSSE)
2 Progress on Vision 2050 Since 1995