

106
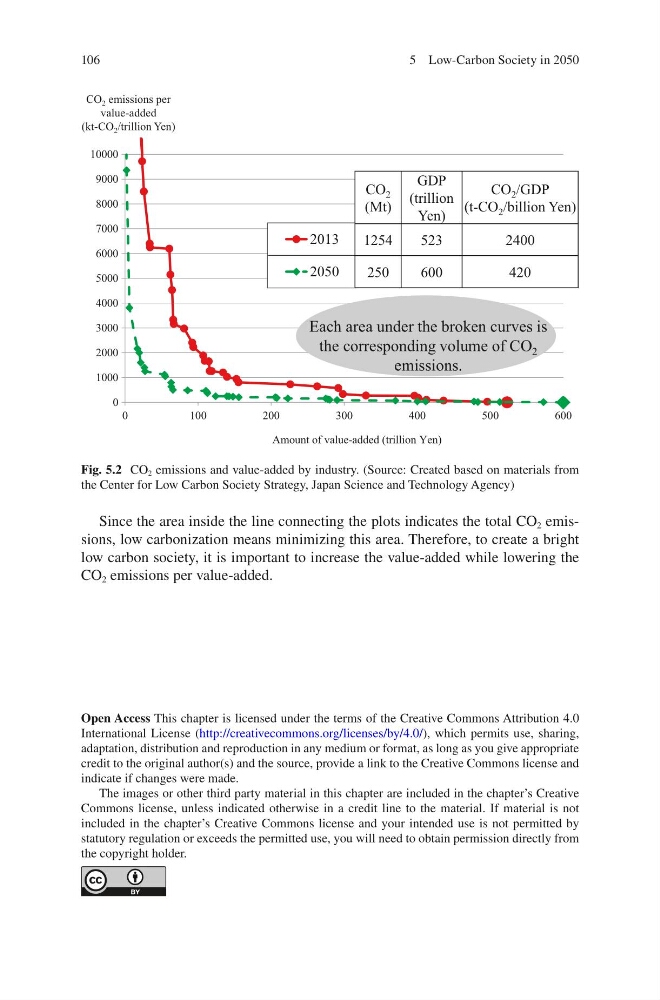
Since the area inside the line connecting the plots indicates the total CO 2 emissions, low carbonization means minimizing this area. Therefore, to create a bright
low carbon society, it is important to increase the value-added while lowering the
CO 2 emissions per value-added.
0
1000
2000
3000
4000
5000
6000
7000
8000
9000
10000
0
1 00
200
3 00
400
5 00
600
2013
2050
CO 2 emissions per
value-added
(kt-CO 2 /trillion Yen)
CO 2
(Mt)
GDP
(trillion
Yen)
CO 2 /GDP
(t-CO 2 /billion Yen)
1254
523
2 400
250
600
420
Amount of value-added (trillion Yen)
Each area under the broken curves is
the corresponding volume of CO 2
emissions.
Fig. 5.2 CO 2 emissions and value-added by industry. (Source: Created based on materials from
the Center for Low Carbon Society Strategy, Japan Science and Technology Agency)
Open Access This chapter is licensed under the terms of the Creative Commons Attribution 4.0
International License (http://creativecommons.org/licenses/by/4.0/), which permits use, sharing,
adaptation, distribution and reproduction in any medium or format, as long as you give appropriate
credit to the original author(s) and the source, provide a link to the Creative Commons license and
indicate if changes were made.
The images or other third party material in this chapter are included in the chapter’s Creative
Commons license, unless indicated otherwise in a credit line to the material. If material is not
included in the chapter’s Creative Commons license and your intended use is not permitted by
statutory regulation or exceeds the permitted use, you will need to obtain permission directly from
the copyright holder.
5 Low-Carbon Society in 2050
Since the area inside the line connecting the plots indicates the total CO 2 emissions, low carbonization means minimizing this area. Therefore, to create a bright
low carbon society, it is important to increase the value-added while lowering the
CO 2 emissions per value-added.
0
1000
2000
3000
4000
5000
6000
7000
8000
9000
10000
0
1 00
200
3 00
400
5 00
600
2013
2050
CO 2 emissions per
value-added
(kt-CO 2 /trillion Yen)
CO 2
(Mt)
GDP
(trillion
Yen)
CO 2 /GDP
(t-CO 2 /billion Yen)
1254
523
2 400
250
600
420
Amount of value-added (trillion Yen)
Each area under the broken curves is
the corresponding volume of CO 2
emissions.
Fig. 5.2 CO 2 emissions and value-added by industry. (Source: Created based on materials from
the Center for Low Carbon Society Strategy, Japan Science and Technology Agency)
Open Access This chapter is licensed under the terms of the Creative Commons Attribution 4.0
International License (http://creativecommons.org/licenses/by/4.0/), which permits use, sharing,
adaptation, distribution and reproduction in any medium or format, as long as you give appropriate
credit to the original author(s) and the source, provide a link to the Creative Commons license and
indicate if changes were made.
The images or other third party material in this chapter are included in the chapter’s Creative
Commons license, unless indicated otherwise in a credit line to the material. If material is not
included in the chapter’s Creative Commons license and your intended use is not permitted by
statutory regulation or exceeds the permitted use, you will need to obtain permission directly from
the copyright holder.
5 Low-Carbon Society in 2050