

104
In Japan, which will have realized a reduction of 80% of CO 2 emissions by 2050,
the total CO 2 emissions would be 250 million tons and the GDP ¥600 trillion. The
CO 2 emissions per ¥1 billion value-added (hereinafter referred to as “CO 2 emissions
per value-added”) is expected to be 420 tons, which is a significant reduction from
the current 2400 tons.
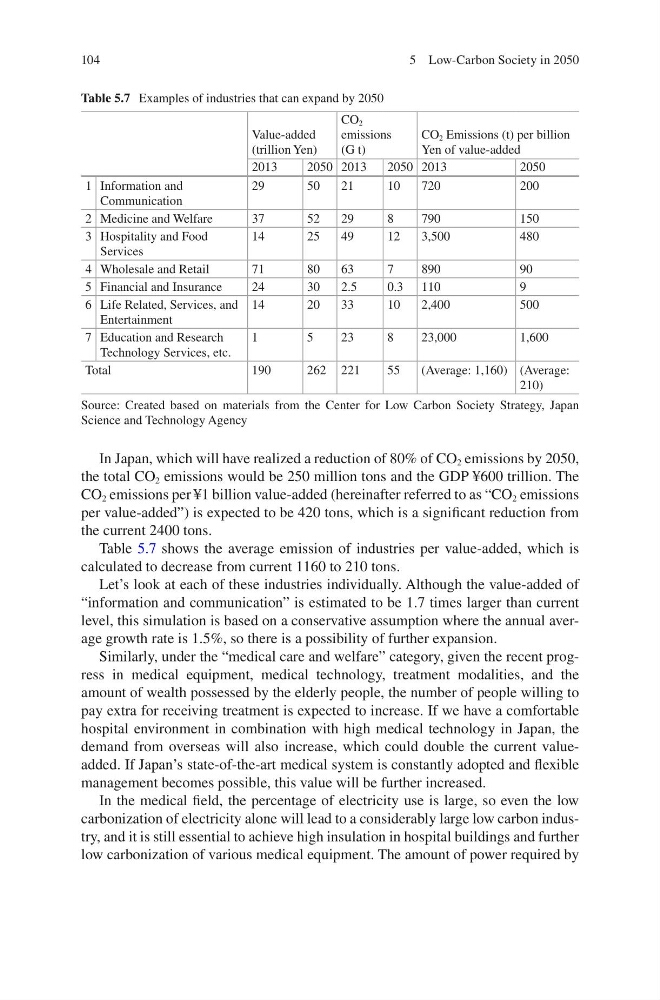
Table 5.7 shows the average emission of industries per value-added, which is
calculated to decrease from current 1160 to 210 tons.
Let’s look at each of these industries individually. Although the value-added of
“information and communication” is estimated to be 1.7 times larger than current
level, this simulation is based on a conservative assumption where the annual average growth rate is 1.5%, so there is a possibility of further expansion.
Similarly, under the “medical care and welfare” category, given the recent progress in medical equipment, medical technology, treatment modalities, and the
amount of wealth possessed by the elderly people, the number of people willing to
pay extra for receiving treatment is expected to increase. If we have a comfortable
hospital environment in combination with high medical technology in Japan, the
demand from overseas will also increase, which could double the current valueadded. If Japan’s state-of-the-art medical system is constantly adopted and flexible
management becomes possible, this value will be further increased.
In the medical field, the percentage of electricity use is large, so even the low
carbonization of electricity alone will lead to a considerably large low carbon industry, and it is still essential to achieve high insulation in hospital buildings and further
low carbonization of various medical equipment. The amount of power required by
Table 5.7 Examples of industries that can expand by 2050
Value-added
(trillion Yen)
CO 2
emissions
(G t)
CO 2 Emissions (t) per billion
Yen of value-added
2013
2050 2013
2050 2013
2050
1 Information and
Communication
29
50
21
10
720
200
2 Medicine and Welfare
37
52
29
8
790
150
3 Hospitality and Food
Services
14
25
49
12
3,500
480
4 Wholesale and Retail
71
80
63
7
890
90
5 Financial and Insurance
24
30
2.5
0.3 110
9
6 Life Related, Services, and
Entertainment
14
20
33
10
2,400
500
7 Education and Research
Technology Services, etc.
1
5
23
8
23,000
1,600
Total
190
262 221
55
(Average: 1,160) (Average:
210)
Source: Created based on materials from the Center for Low Carbon Society Strategy, Japan
Science and Technology Agency
5 Low-Carbon Society in 2050
In Japan, which will have realized a reduction of 80% of CO 2 emissions by 2050,
the total CO 2 emissions would be 250 million tons and the GDP ¥600 trillion. The
CO 2 emissions per ¥1 billion value-added (hereinafter referred to as “CO 2 emissions
per value-added”) is expected to be 420 tons, which is a significant reduction from
the current 2400 tons.
Table 5.7 shows the average emission of industries per value-added, which is
calculated to decrease from current 1160 to 210 tons.
Let’s look at each of these industries individually. Although the value-added of
“information and communication” is estimated to be 1.7 times larger than current
level, this simulation is based on a conservative assumption where the annual average growth rate is 1.5%, so there is a possibility of further expansion.
Similarly, under the “medical care and welfare” category, given the recent progress in medical equipment, medical technology, treatment modalities, and the
amount of wealth possessed by the elderly people, the number of people willing to
pay extra for receiving treatment is expected to increase. If we have a comfortable
hospital environment in combination with high medical technology in Japan, the
demand from overseas will also increase, which could double the current valueadded. If Japan’s state-of-the-art medical system is constantly adopted and flexible
management becomes possible, this value will be further increased.
In the medical field, the percentage of electricity use is large, so even the low
carbonization of electricity alone will lead to a considerably large low carbon industry, and it is still essential to achieve high insulation in hospital buildings and further
low carbonization of various medical equipment. The amount of power required by
Table 5.7 Examples of industries that can expand by 2050
Value-added
(trillion Yen)
CO 2
emissions
(G t)
CO 2 Emissions (t) per billion
Yen of value-added
2013
2050 2013
2050 2013
2050
1 Information and
Communication
29
50
21
10
720
200
2 Medicine and Welfare
37
52
29
8
790
150
3 Hospitality and Food
Services
14
25
49
12
3,500
480
4 Wholesale and Retail
71
80
63
7
890
90
5 Financial and Insurance
24
30
2.5
0.3 110
9
6 Life Related, Services, and
Entertainment
14
20
33
10
2,400
500
7 Education and Research
Technology Services, etc.
1
5
23
8
23,000
1,600
Total
190
262 221
55
(Average: 1,160) (Average:
210)
Source: Created based on materials from the Center for Low Carbon Society Strategy, Japan
Science and Technology Agency
5 Low-Carbon Society in 2050