

89
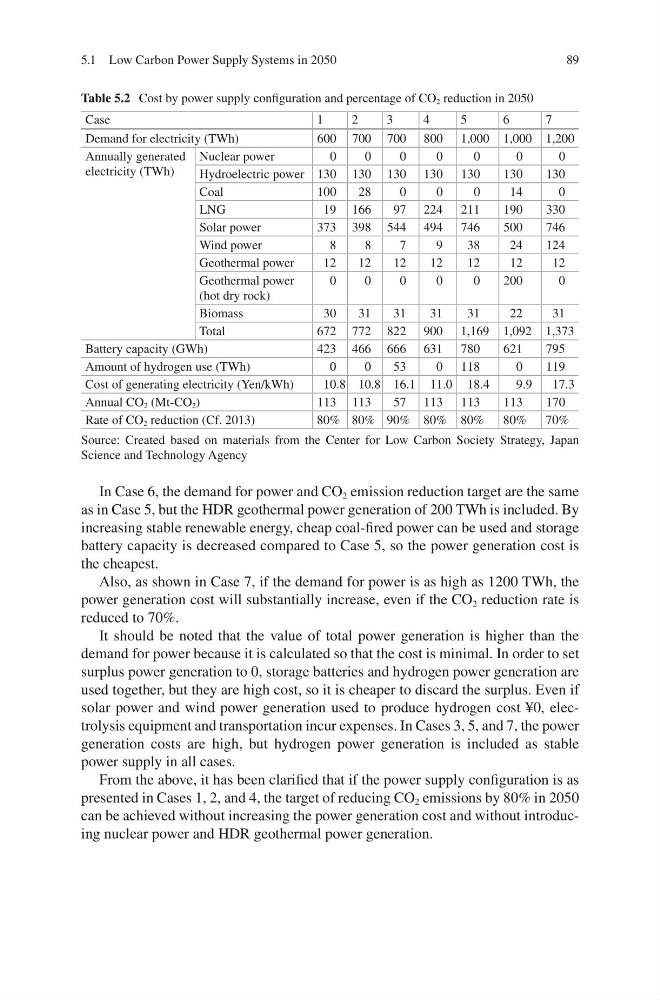
In Case 6, the demand for power and CO 2 emission reduction target are the same
as in Case 5, but the HDR geothermal power generation of 200 TWh is included. By
increasing stable renewable energy, cheap coal-fired power can be used and storage
battery capacity is decreased compared to Case 5, so the power generation cost is
the cheapest.
Also, as shown in Case 7, if the demand for power is as high as 1200 TWh, the
power generation cost will substantially increase, even if the CO 2 reduction rate is
reduced to 70%.
It should be noted that the value of total power generation is higher than the
demand for power because it is calculated so that the cost is minimal. In order to set
surplus power generation to 0, storage batteries and hydrogen power generation are
used together, but they are high cost, so it is cheaper to discard the surplus. Even if
solar power and wind power generation used to produce hydrogen cost ¥0, electrolysis equipment and transportation incur expenses. In Cases 3, 5, and 7, the power
generation costs are high, but hydrogen power generation is included as stable
power supply in all cases.
From the above, it has been clarified that if the power supply configuration is as
presented in Cases 1, 2, and 4, the target of reducing CO 2 emissions by 80% in 2050
can be achieved without increasing the power generation cost and without introducing nuclear power and HDR geothermal power generation.
Table 5.2 Cost by power supply configuration and percentage of CO 2 reduction in 2050
Case
1
2
3
4
5
6
7
Demand for electricity (TWh)
600 700 700 800 1,000 1,000 1,200
Annually generated
electricity (TWh)
Nuclear power
0
0
0
0
0
0
0
Hydroelectric power 130 130 130 130 130
130
130
Coal
100
28
0
0
0
14
0
LNG
19 166
97 224 211
190
330
Solar power
373 398 544 494 746
500
746
Wind power
8
8
7
9
38
24
124
Geothermal power
12
12
12
12
12
12
12
Geothermal power
(hot dry rock)
0
0
0
0
0
200
0
Biomass
30
31
31
31
31
22
31
Total
672 772 822 900 1,169 1,092 1,373
Battery capacity (GWh)
423 466 666 631 780
621
795
Amount of hydrogen use (TWh)
0
0
53
0 118
0
119
Cost of generating electricity (Yen/kWh)
10.8 10.8 16.1 11.0 18.4
9.9
17.3
Annual CO 2 (Mt-CO 2 )
113 113
57 113 113
113
170
Rate of CO 2 reduction (Cf. 2013)
80% 80% 90% 80% 80%
80%
70%
Source: Created based on materials from the Center for Low Carbon Society Strategy, Japan
Science and Technology Agency
5.1 Low Carbon Power Supply Systems in 2050
In Case 6, the demand for power and CO 2 emission reduction target are the same
as in Case 5, but the HDR geothermal power generation of 200 TWh is included. By
increasing stable renewable energy, cheap coal-fired power can be used and storage
battery capacity is decreased compared to Case 5, so the power generation cost is
the cheapest.
Also, as shown in Case 7, if the demand for power is as high as 1200 TWh, the
power generation cost will substantially increase, even if the CO 2 reduction rate is
reduced to 70%.
It should be noted that the value of total power generation is higher than the
demand for power because it is calculated so that the cost is minimal. In order to set
surplus power generation to 0, storage batteries and hydrogen power generation are
used together, but they are high cost, so it is cheaper to discard the surplus. Even if
solar power and wind power generation used to produce hydrogen cost ¥0, electrolysis equipment and transportation incur expenses. In Cases 3, 5, and 7, the power
generation costs are high, but hydrogen power generation is included as stable
power supply in all cases.
From the above, it has been clarified that if the power supply configuration is as
presented in Cases 1, 2, and 4, the target of reducing CO 2 emissions by 80% in 2050
can be achieved without increasing the power generation cost and without introducing nuclear power and HDR geothermal power generation.
Table 5.2 Cost by power supply configuration and percentage of CO 2 reduction in 2050
Case
1
2
3
4
5
6
7
Demand for electricity (TWh)
600 700 700 800 1,000 1,000 1,200
Annually generated
electricity (TWh)
Nuclear power
0
0
0
0
0
0
0
Hydroelectric power 130 130 130 130 130
130
130
Coal
100
28
0
0
0
14
0
LNG
19 166
97 224 211
190
330
Solar power
373 398 544 494 746
500
746
Wind power
8
8
7
9
38
24
124
Geothermal power
12
12
12
12
12
12
12
Geothermal power
(hot dry rock)
0
0
0
0
0
200
0
Biomass
30
31
31
31
31
22
31
Total
672 772 822 900 1,169 1,092 1,373
Battery capacity (GWh)
423 466 666 631 780
621
795
Amount of hydrogen use (TWh)
0
0
53
0 118
0
119
Cost of generating electricity (Yen/kWh)
10.8 10.8 16.1 11.0 18.4
9.9
17.3
Annual CO 2 (Mt-CO 2 )
113 113
57 113 113
113
170
Rate of CO 2 reduction (Cf. 2013)
80% 80% 90% 80% 80%
80%
70%
Source: Created based on materials from the Center for Low Carbon Society Strategy, Japan
Science and Technology Agency
5.1 Low Carbon Power Supply Systems in 2050